
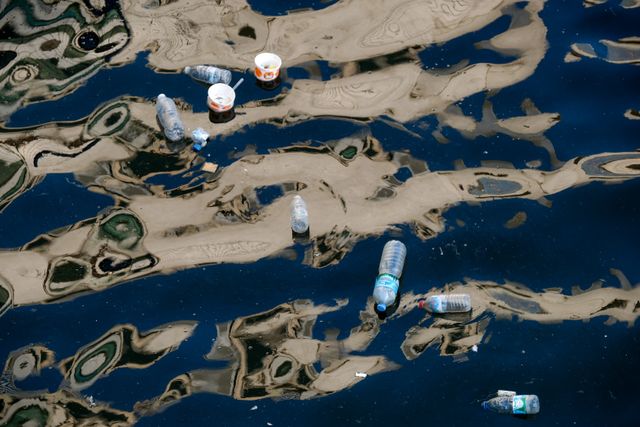
The world makes more than 430 million tonnes of plastic a year, actually recycles about 9% of its plastic waste, and still loses millions of tonnes to the environment. The longer version is where it gets confusing, because “plastic production,” “plastic waste,” “mismanaged waste” and “plastic pollution” are four different measurements, and reputable sources report very different numbers for each.
This page pulls the key figures into one place, shows the year and source for each, and explains which numbers can be compared and which can’t.
Plastic pollution statistics at a glance
| Statistic | Figure | Year | Source |
| Global plastics production | 430.9 million tonnes | 2024 | Plastics Europe |
| Global plastics production (wider OECD scope) | 460 million tonnes | 2019 | OECD |
| Plastic waste generated | 353 million tonnes | 2019 | OECD |
| Plastic waste actually recycled | 9% | 2019 | OECD |
| Plastic waste mismanaged | 22% | 2019 | OECD |
| Plastic leaked into the environment | 22 million tonnes | 2019 | OECD |
| Municipal macroplastic pollution emissions | 52.1 million tonnes | 2020 | Cottom et al., Nature (2024) |
| Plastic entering the ocean each year | about 1–2 million tonnes | Recent models | Our World in Data |
| Projected annual waste, baseline scenario | 1.014 billion tonnes | 2060 | OECD |
Global plastics production reached 430.9 million tonnes in 2024, according to Plastics Europe.
How to read these numbers
Most global figures here are from 2019 or 2020 because worldwide datasets take years to compile. The OECD’s 2019 estimates are still the main global reference, so we use them and label every year. Four rules keep the numbers honest:
- Different measurements don’t add up. The 353 million tonnes of waste, 22 million tonnes of leakage and 52.1 million tonnes of emissions measure different things, so don’t sum them.
- Mismanaged is not the same as leaked. Waste in an open dump is more likely to escape, but a tonne of mismanaged waste is not a tonne in the ocean.
- Collected is not the same as recycled. A bottle in the recycling bin has only entered the system. Sorting, contamination and demand decide whether it becomes a new product.
- Keep sources separate. The OECD and Plastics Europe define “plastics” differently, so their time series shouldn’t share a chart.
What’s new in 2025–2026
The global plastics treaty is still unfinished. Talks in Geneva in August 2025 ended without an agreement, and the committee’s chair resigned. On 7 February 2026, countries met for a one-day procedural session and elected Chile’s Julio Cordano as the new chair. He has since released an “Aid to Negotiations” text to restart the process, with informal talks in Bangkok on 27–30 September 2026 and formal negotiations (INC-5.4) planned for March 2027. Campaigners argue the new draft weakens key measures, including limits on production, which remains the most divisive issue.
EU packaging rules took effect. The EU Packaging and Packaging Waste Regulation (PPWR) has applied since 12 August 2026. It sets common EU-wide rules on recyclability, labelling, reuse and minimising packaging, and it limits PFAS chemicals in food-contact packaging. Not every provision applies yet, and member states must put national penalty systems in place by 12 February 2027.
Production keeps shifting east. China accounts for roughly a third of global plastics production, while Europe’s share has fallen from about 20% in 2014 to about 12%.
Global plastic production statistics
How much plastic is produced each year?
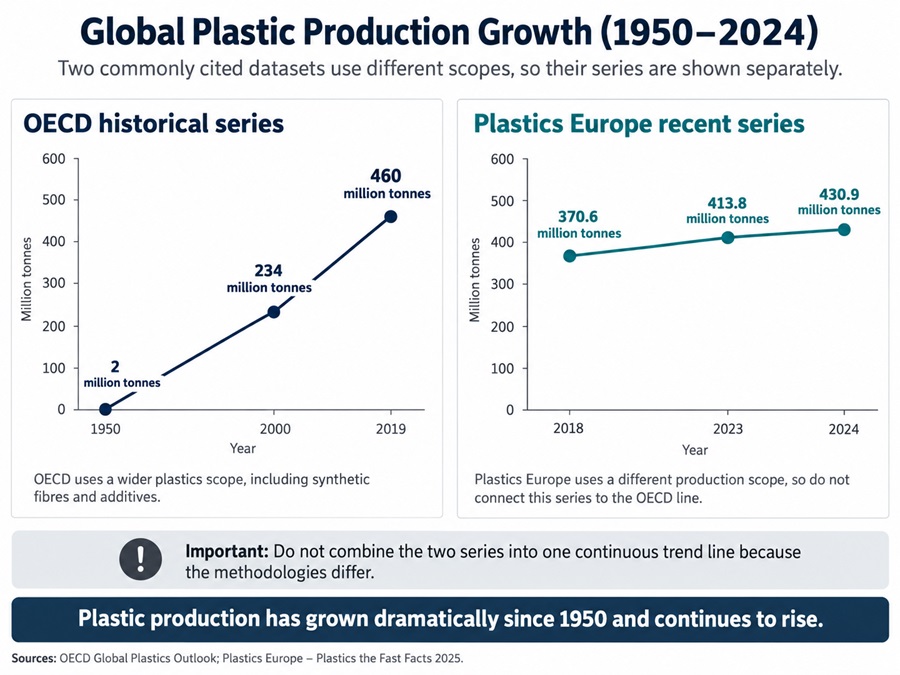
Plastics Europe reports 430.9 million tonnes in 2024, up from 413.8 million tonnes in 2023 (about 4.1% growth) and 370.6 million tonnes in 2018 (about 16.3% growth in six years). The OECD’s wider definition, which includes synthetic fibres and additives, put 2019 production at 460 million tonnes.
How has production changed since 1950?
OECD historical data shows a rise from about 2 million tonnes in 1950 to 234 million in 2000 and 460 million in 2019, roughly 230 times higher in 69 years. Even as recycling improves, the amount of new plastic entering the economy keeps rising, which is why waste systems struggle to catch up.
Where does the plastic go?
Packaging, construction and transportation together account for more than 60% of plastic use by weight, according to the OECD. What matters for pollution is how long the product lasts. A pipe can stay in a wall for decades, while a food wrapper is discarded within minutes.
What’s the climate cost?
The OECD estimates plastics were responsible for about 3.4% of global greenhouse gas emissions in 2019, most of it from producing the plastic, not from disposing of it. That makes production a climate issue as well as a waste issue.
Global plastic waste statistics
How much plastic waste does the world generate?
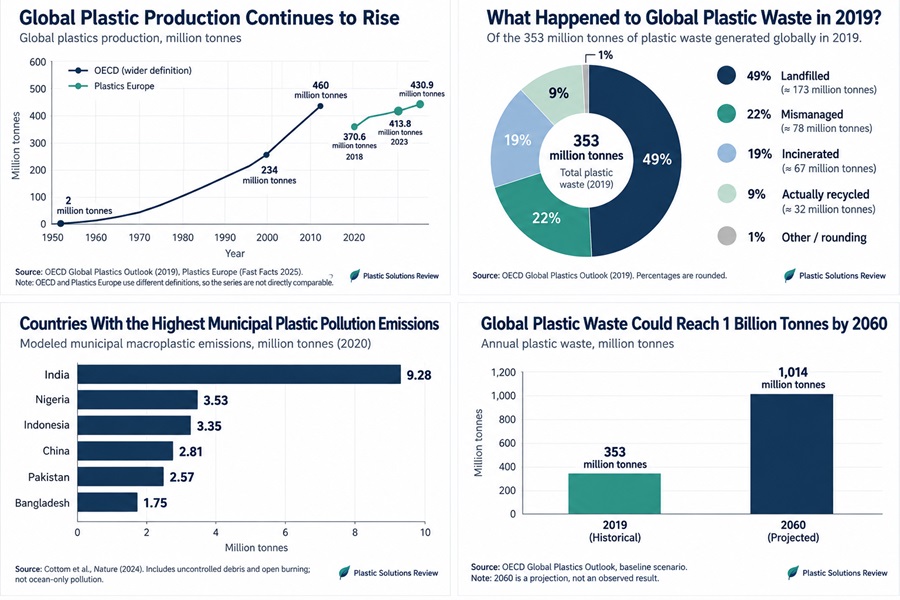
Global plastic waste more than doubled from 156 million tonnes in 2000 to 353 million tonnes in 2019, an increase of about 126%. Long-lived products turn into waste years after they’re made, while short-lived packaging moves through the economy much faster, so production and waste don’t rise in lockstep.
Where does plastic waste end up?
| Destination | Share of global waste, 2019 |
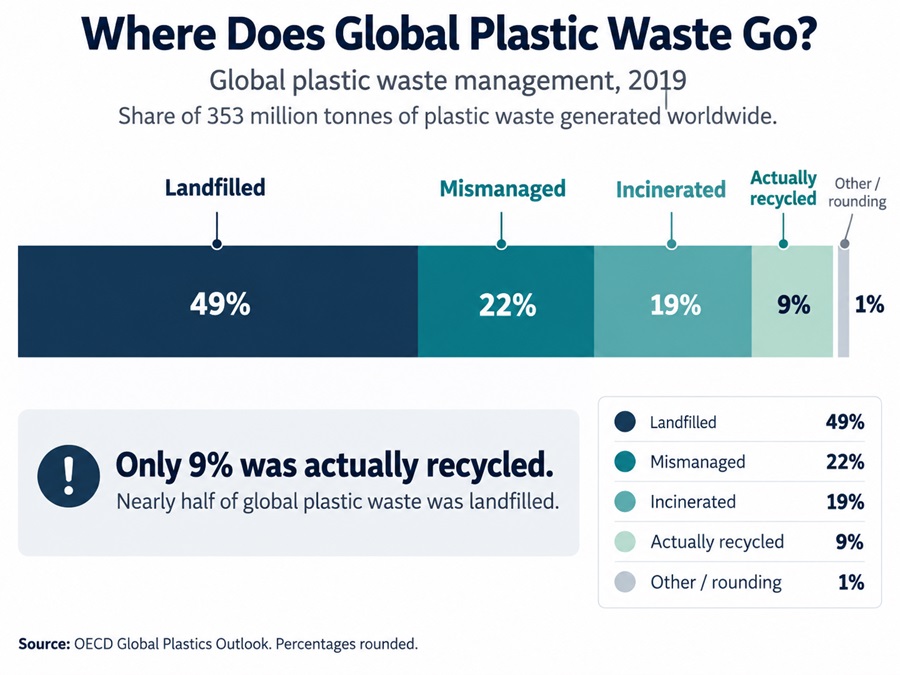
| Landfilled | about 49% |
| Mismanaged | 22% |
| Incinerated | 19% |
| Actually recycled | 9% |
| Rounding / other | about 1% |
Nearly half of plastic waste goes to landfill. A well-managed landfill keeps plastic out of the open environment but recovers none of its value. Incineration cuts volume and can recover energy, but it destroys the material and needs emission controls.
How much is mismanaged, and how much escapes?
About 22% of plastic waste was mismanaged in 2019, meaning it was dumped, openly burned or otherwise handled without adequate safeguards. Separately, the OECD estimates that 22 million tonnes leaked into the environment that year, including both macroplastics and microplastics.
Which products create the most waste?
Packaging made up about 40% of plastic waste in 2019, consumer products 12% and textiles 11%, about 63% combined. Packaging dominates because most of it is used once and discarded quickly.
Plastic recycling statistics
What percentage of plastic is recycled?
Only 9% of plastic waste was actually recycled in 2019, according to the OECD. About 15% was collected for recycling, but sorting and processing losses cut that to roughly 33 million tonnes out of 55 million tonnes collected.
Why is plastic so hard to recycle?
Plastics come in many polymers that need different processing, and food residue, labels, adhesives and mixed materials all lower the quality of the recovered material. Recycled plastic also has to compete with virgin plastic on cost, consistency and supply.
| Type of plastic | Recycling prospects |
| PET bottles | Widely recycled; strongest markets |
| HDPE containers (milk jugs, detergent bottles) | Widely recycled |
| Polypropylene (tubs, caps) | Recycled in many regions, but less consistently |
| Flexible films and bags | Often rejected at sorting; limited recovery |
| Multilayer packaging | Very difficult to separate and recycle |
| Polystyrene and foam | Rarely recycled |
For the full breakdown, see our Plastic Recycling Codes 1–7 guide.
Is recycling getting better?
Plastics Europe estimates that mechanically recycled post-consumer plastic made up 9.5% of global plastics production in 2024. That isn’t the same measure as the OECD’s 9% waste recycling rate: one is recycled content as a share of production, the other is recycled material as a share of waste. The two numbers look alike but can’t be compared.
Ocean and freshwater plastic pollution statistics
How much plastic enters the ocean each year?
Recent estimates summarised by Our World in Data put the figure at about 1–2 million tonnes a year. The OECD estimated 1.7 million tonnes for 2019, with about 1.4 million tonnes arriving through rivers and 0.3 million through coastal pathways. This is well below the older, widely repeated figure of 8 million tonnes. Newer models account for how long plastic stays trapped in rivers and lakes before it reaches the sea.
How much reaches rivers, lakes and seas combined?
UNEP estimates 19–23 million tonnes of plastic waste enter aquatic ecosystems each year. The OECD’s 2019 model gives 6.1 million tonnes. The methods and definitions differ, so treat them as separate estimates, and neither is an ocean-only number.
How much plastic is already in the water?
The OECD estimates about 30 million tonnes had accumulated in the ocean by 2019 and another 109 million tonnes in rivers. UNEP cites a broader range of 75–199 million tonnes in the ocean, drawing on other studies. The range is wide because floating debris, deep-sea sediment, sinking and fragmentation are hard to measure. Annual inflow and the total stock are also different questions.
See our Ocean Plastic Pollution guide for more.
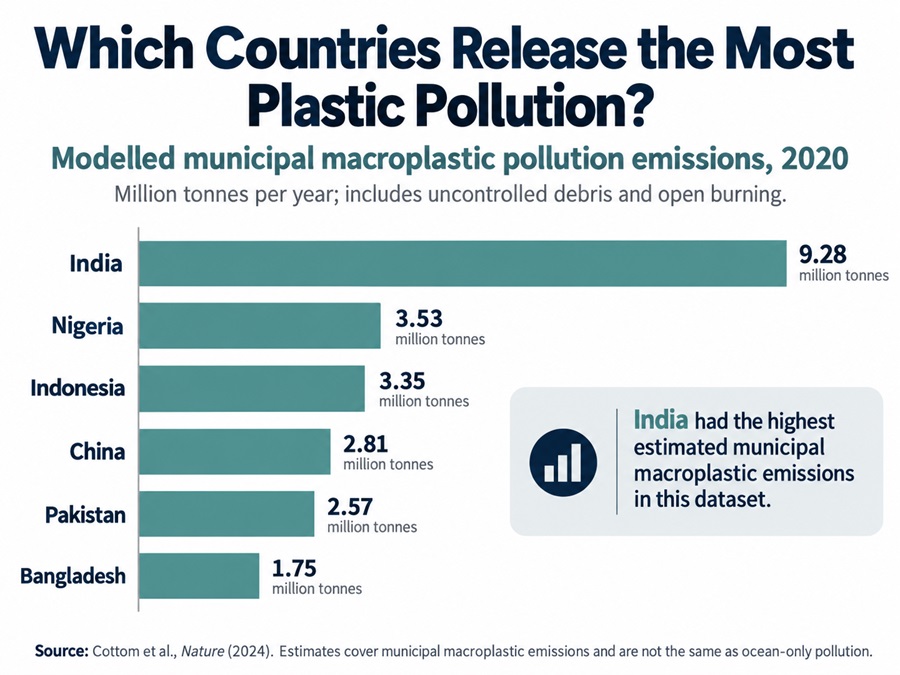
Plastic pollution by country
Which countries release the most plastic pollution?
A 2024 study in Nature modelled municipal macroplastic emissions across more than 50,000 municipalities. It counted both uncontrolled debris and open burning.
| Country | Modelled emissions, 2020 |
| India | 9.28 million tonnes |
| Nigeria | 3.53 million tonnes |
| Indonesia | 3.35 million tonnes |
| China | 2.81 million tonnes |
| Pakistan | 2.57 million tonnes |
| Bangladesh | 1.75 million tonnes |
The study’s global total was 52.1 million tonnes, of which about 57% was openly burned and about 43% was uncontrolled debris. These figures aren’t directly comparable with the OECD’s leakage totals because the definitions differ.
Why does the ranking look like this?
The ranking tracks waste management more than consumption. High-income countries usually discard more plastic per person, but reliable collection and controlled disposal keep most of it contained. The Nature study found uncollected waste was the main source in many lower-income regions, while littering played a bigger role in higher-income ones.
So the fixes differ by region: basic collection and controlled disposal in some places, packaging reduction, redesign and better recycling in others.
Microplastic pollution statistics
Microplastics are plastic particles smaller than 5 millimetres. Some are manufactured that small, but many come from larger items wearing down or breaking apart.
The OECD estimated that microplastics made up about 12% of the 22 million tonnes of plastic leakage in 2019, roughly 2.6 million tonnes. The main sources are tyre wear, synthetic textile fibres, industrial pellet losses, road markings and the fragmentation of discarded plastic. They travel through wastewater, stormwater and air, and they build up in soil.
Researchers have detected microplastics in human blood and tissue samples, and in wildlife across ecosystems. How much harm they cause to human health is still being researched, so be cautious with any source that states it with certainty.
Microplastic statistics are also hard to compare. One study reports particles per litre, another reports total mass, and others cover only certain size ranges, so check units, definitions and methods before putting two numbers side by side. See our Microplastics and Nanoplastics guides for more.
Future projections: 2030, 2040 and 2060
These are modelled scenarios based on assumptions about population, economic growth and plastic use, not measured outcomes.
If nothing changes (OECD baseline): annual plastic waste rises from 353 million tonnes in 2019 to about 1.014 billion tonnes by 2060, nearly triple. Annual leakage roughly doubles from 22 to 44 million tonnes. The recycling rate improves from 9% to about 17%, but most of a much larger waste stream still goes elsewhere.
With ambitious policy (OECD scenario): 2060 waste falls to about 679 million tonnes and recycling reaches around 60%, with leakage cut sharply. That would take coordinated action on production, design, collection, recycling and disposal.
UNEP’s 2040 scenario: the 2023 Turning off the Tap report found that scaling up existing measures (cutting unnecessary plastic, reuse, better recycling and appropriate substitutes) could reduce plastic pollution by about 80% by 2040.
The gap between these scenarios is the argument for the treaty talks and regulations covered above. Which path the world follows depends on policy decisions still being made.
Frequently asked questions
How much plastic waste is produced every year?
The OECD’s latest global estimate is 353 million tonnes, for 2019. No measured 2026 figure exists yet.
What percentage of plastic is recycled?
About 9% was actually recycled in 2019. Around 15% was collected for recycling, but some of it was lost in sorting and processing.
How much plastic enters the ocean every year?
About 1–2 million tonnes a year according to recent research, with the OECD’s 2019 estimate at 1.7 million tonnes.
Which country has the most plastic pollution?
India, with about 9.3 million tonnes of modelled municipal macroplastic emissions in 2020, according to the 2024 Nature study. Rankings change depending on whether you measure waste generated, waste mismanaged or emissions.
Is plastic pollution increasing or decreasing?
Increasing globally. Production and waste have both risen for decades, and OECD models project further growth without stronger policy, even though waste management has improved in some places.
The bottom line
No single number captures plastic pollution. The real story is the gap between how much plastic we make, how much we recover and how much slips out of proper management. Closing it means making less unnecessary plastic, designing products to last or be reused, collecting waste everywhere, and recycling what’s left. With treaty talks unresolved and new EU rules only just in force, the next few years will show which scenario the world follows.
Leave a Reply