Waste-to-energy (WtE) turns waste into electricity, heat or fuel. For plastic, that mostly means burning it in a controlled plant to make steam, or heating it in low-oxygen systems (gasification, pyrolysis) to make gas and oil. It cuts the volume of waste going to landfill and squeezes value out of plastic that can’t realistically be recycled. The catch: it destroys the plastic, releases fossil CO₂, and only makes sense for residual waste, not for plastic that recycling could have saved.
How Plastic Waste Becomes Energy
The details vary by technology, but a conventional plant follows the same path:
- Delivery and sorting. Trucks tip mixed waste into a bunker. Operators pull out bulky items, hazardous material and, where a system exists, recyclables. Some plants shred the rest into a more uniform fuel.
- Thermal conversion. The waste is burned (incineration), heated with little oxygen (gasification) or heated with none (pyrolysis).
- Energy recovery. In an incinerator, the heat boils water, and the steam spins a turbine. Many plants also send hot water or steam to nearby buildings or factories, which is called combined heat and power (CHP).
- Cleaning the exhaust. Filters and scrubbers strip out particles and acid gases before anything reaches the stack.
- Handling the leftovers. Combustion leaves ash and other residues. The S. EPA reports that municipal solid waste combustion ash commonly accounts for about 15–25% of the input waste by weight, although the amount varies with the waste and process. Bottom ash may contain recoverable metals. Fly ash and air-pollution-control residues require careful, specialist management.
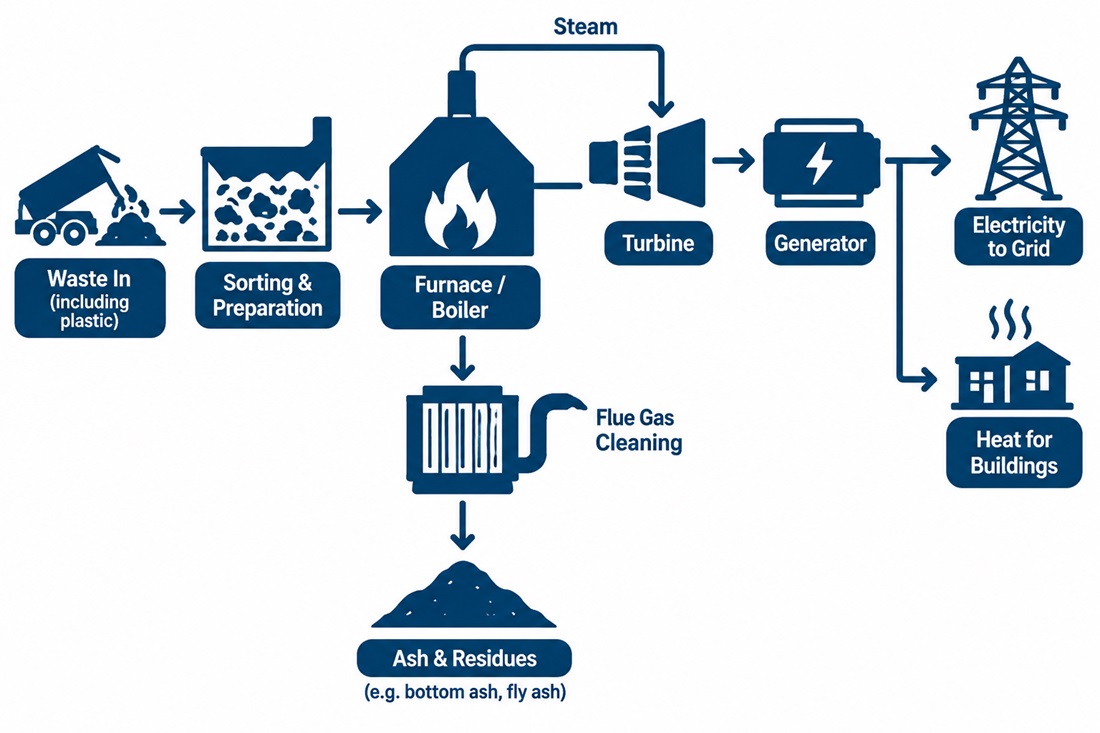
Combustion can substantially reduce waste volume, but the waste does not vanish. It becomes ash, treated flue gas and recovered heat. The exact reduction depends on the waste composition and plant.
The Main Technologies
We cover each in detail elsewhere. Here’s how they compare for plastic:
| Technology | What happens | Main output | Maturity | Fit for plastic |
| Incineration | Controlled burning with excess air | Steam, electricity, heat | Proven, widespread | Good, as part of mixed waste. Incineration |
| Gasification | Heating with limited oxygen or steam | Syngas (hydrogen, carbon monoxide) | Few reliable commercial plants | Possible, but demanding on feedstock and gas cleaning |
| Pyrolysis | Heating without oxygen | Oil, gas, char | Mixed track record | Can make fuel or chemical feedstock. Plastic Pyrolysis, Plastic-to-Fuel |
| Cement kiln co-processing | Shredded waste fuel replaces coal or petcoke | Industrial heat | Established in many countries | Good for RDF with plastic |
Two more get mentioned in WtE discussions, but they’re mostly irrelevant for plastic. Anaerobic digestion makes biogas from food and farm waste, and conventional plastic doesn’t break down in it. Landfill gas capture collects methane from rotting organic waste, which plastic barely produces. Their main role is in the organic part of mixed waste.
One caution on newer technologies: commercial performance varies by project. Gasification and pyrolysis plants can face challenges with feedstock consistency, process reliability, gas cleaning, product quality and cost. Before accepting a performance claim, look for independently verified operating data, uptime, output quality and full-scale operating history.
Which Plastics Work, and Which Don’t
Many common plastics are made from fossil feedstocks and have high energy content. Polyethylene (PE) and polypropylene (PP) can release substantially more heat per kilogram than wet mixed municipal waste. Actual heating values vary with polymer type, additives, contamination and moisture, so plant operators assess the feedstock rather than relying on a single generic value.
But not every plastic is equal:
| Plastic waste | Best route | Why |
| Clean PET bottles, HDPE containers | Recycle | Strong markets, high material value |
| Clean PE/PP film and rigid items | Recycle if collected, otherwise energy recovery | Recyclable in principle, but depends on local systems |
| Multilayer pouches, heavily contaminated plastic | Energy recovery | Often not practically recyclable |
| PVC | Careful | About 57% chlorine by mass in the polymer repeat unit; combustion requires careful acid-gas control and monitoring. |
| Plastics mixed with hazardous waste | Specialist handling | Don’t send to a standard plant |
The point of this table: “burns well” is not a reason to burn. Whether a plastic is recyclable depends on contamination, collection and local markets. Don’t label it “non-recyclable” just because no one near you recycles it.
The Numbers That Matter
- Energy yield. Electricity output per tonne varies widely with waste composition, moisture, plant design and energy recovery. Use facility-specific data when comparing plants; a generic kWh-per-tonne figure can be misleading.
- Electricity-only plants convert only part of the waste’s energy into electricity. Combined heat and power (CHP) can use more of the available energy when there is a reliable demand for heat. Reported efficiency depends on the calculation method and whether useful heat is included.
- The EU’s R1 test. Under the EU Waste Framework Directive, certain municipal waste incinerators qualify as a recovery operation (R1) only when they meet an energy-efficiency threshold: 0.60 for older installations and 0.65 for installations permitted after 31 December 2008, subject to the directive’s formula and applicable corrections. This is an EU classification rule, not a universal global standard.
- Polyethylene contains a high proportion of fossil carbon. Burning it releases fossil CO₂; the amount depends on the polymer and combustion conditions. Conventional flue-gas filters do not remove CO₂, although separate carbon-capture systems may capture some emissions.
Benefits
- Less landfill. Combustion can substantially reduce the volume of residual waste requiring disposal, although ash and air-pollution-control residues still need management.
- Energy from hard-to-recycle residue. Plastic that would otherwise be buried or dumped can generate power and heat.
- Reliable local energy. Waste supply is steady, and heat networks make good use of it.
- Metals recovered. Bottom ash processing can retrieve ferrous and non-ferrous metals.
Limits and Risks
CO₂ and climate. Burning plastic releases fossil carbon. Food and paper waste emit “biogenic” CO₂, which is accounted for differently, but plastic doesn’t get that pass. Whether a plant helps or hurts the climate depends on what energy it displaces. Against coal, it may look good. Against a clean grid, it doesn’t.
Air pollution. Modern plants control particulates, acid gases and dioxins well, but only if they’re built, run and monitored properly. Open burning, which is common where collection systems are weak, is far worse.
Ash. Fly ash and filter residues are toxic and need secure treatment. Some of the burden moves from landfill to specialist disposal.
Cost and lock-in. Plants need large investment and a steady flow of waste for decades. That creates pressure to keep feeding the furnace, even with material that recycling could have captured.
Underperforming technology. See the gasification and pyrolysis caution above.
The 2026 Policy Update: Carbon Pricing Is Coming
This is the biggest recent shift in Europe, and it will reshape the economics.
- On 17 July 2026, the European Commission proposed extending the EU Emissions Trading System (ETS) to certain non-hazardous waste incineration and co-incineration activities.
- Under the proposal, the obligation would be phased in from 2031 to 2034, reaching 100% of covered verified emissions in 2034. The proposal also includes a temporary opt-out mechanism for eligible Member States and a time-limited derogation for certain outermost regions. These provisions are proposed, not yet final law.
- The proposal would keep hazardous-waste incineration outside the expanded ETS scope.
- The UK ETS Authority confirmed in August 2026 that the planned expansion to waste incineration would not take place in 2028. A replacement timeline has not yet been announced.
- Some European countries have introduced national carbon-pricing or related measures that affect waste incineration, but the scope and treatment differ by country. Check the current national rules before listing individual countries or comparing costs.
The EU ETS extension remains a legislative proposal and may change during the approval process. If adopted, it could increase the cost of incinerating fossil-based plastic and strengthen incentives to reduce emissions. The actual effect will depend on the final rules, carbon prices, plant-specific emissions and available alternatives. Carbon capture projects should be described only with verified project status and operating data.
Two other policy areas matter: the EU Packaging and Packaging Waste Regulation (PPWR), which introduces requirements affecting packaging design, recyclability and recycled content, and international negotiations on a global plastics treaty. Check the latest official status before describing the treaty negotiations as resolved or unresolved.
Real-World Examples
Two Scandinavian plants show both the upside and the catch.
Klemetsrud, Oslo (Hafslund Celsio). Norway’s largest WtE plant burns residual waste, roughly 350,000–400,000 tonnes a year (source), and sends the heat into Oslo’s district heating network. Residents sort food waste and plastic into coloured bags, which an optical sorter separates from the rest (CNN, 2019) [verify current practice]. The city says the plant’s CO₂ comes mostly from burning plastic, and that it is Oslo’s single largest emitter, at 17% of direct emissions (Klima Oslo). The fix is carbon capture, designed for up to 400,000 tonnes of CO₂ a year. Costs forced a pause in 2023, the project resumed in January 2025, and one investor source now expects it to run in 2029 (Storebrand) [verify current timeline].
CopenHill (Amager Bakke), Copenhagen. The plant, famous for its rooftop ski slope, burns non-recyclable waste for electricity and heat. Earlier figures from its operator ARC put its emissions at 480,000 tonnes of CO₂ a year, of which 160,000 tonnes were fossil CO₂ from plastic (source) [verify current figures]. A Danish journalism report says it imports over 10% of its waste, mainly from the UK, with a higher plastic share (Resonans). ARC and E.ON are planning CopenCapture, which aims to capture 400,000 tonnes of CO₂ a year and store it underground, but it depends on government funding.
What they teach. Even highly efficient plants can’t escape the carbon in plastic, and capture is expensive and slow to build. The cheaper climate win is keeping recyclable plastic out of the furnace in the first place.
Waste-to-Energy vs Recycling
| Waste-to-Energy | Recycling | |
| Goal | Recover energy | Recover material |
| What happens to plastic | Destroyed | Kept in circulation |
| Output | Electricity, heat, fuel | New plastic products |
| Reduces need for virgin plastic | No | Yes |
| Works best for | Residual, contaminated, multilayer waste | Clean, sorted, collected waste |
| Main limit | Fossil CO₂, ash, material lost | Contamination, quality, market demand |
The waste hierarchy puts prevention and reuse first, then recycling, then energy recovery, with disposal last. In practice that means using WtE for what’s left after you’ve tried everything above it. For how it compares with landfilling, see [Landfill vs Incineration].
Waste-to-Energy in Low- and Middle-Income Countries
The European model doesn’t transfer automatically. Common problems:
- Wet, low-energy waste. Mixed waste with a high share of food scraps has a low calorific value, so plants may need extra fuel or struggle to run well.
- Informal recyclers. Waste pickers recover plastic that would otherwise feed a plant. A new incinerator can cut their income and, in some cases, take away the most recyclable material.
- Collection gaps. If a large share of waste is never collected, a plant doesn’t solve the problem.
- Cost and operations. Imported equipment, skilled operators, reliable collection and environmental monitoring can be expensive. Project performance should be assessed using current, independently verified operating records rather than headlines or planned capacity.
Often the better first investment is in collection, sorting and [Material Recovery Facilities], with WtE added later for the true residual.
FAQ
Is waste-to-energy the same as incineration? Not quite. Incineration is the burning process. It becomes waste-to-energy when the plant captures the heat for power or heating. Gasification and pyrolysis can also count as WtE.
Can plastic waste really generate electricity? Yes. Burned in a suitable plant, plastic heats water into steam, which drives a turbine. Plastic’s high energy content makes it effective fuel.
Is WtE better than recycling? For plastic that can be effectively recycled, recycling generally preserves more material value. Whether WtE is preferable to landfill for residual plastic depends on local conditions, plant performance, emissions, and the available alternatives.
Does it release CO₂? Yes. Burning plastic releases fossil CO₂. The amount depends on the plastic type and amount burned. Energy recovery may offset some emissions from other energy sources, while carbon capture can capture a portion of stack emissions if installed and operated.
Can WtE solve plastic pollution? No. It treats waste that has already been collected. It does nothing about littering, mismanaged waste or the amount of plastic produced.
Conclusion
Waste-to-energy can be useful for residual plastic waste, but it is a poor choice for material that can be prevented, reused or effectively recycled. The EU’s proposed carbon-pricing changes may affect future plant economics, but the proposal is not yet final. The priority remains reducing plastic use, reusing products, recycling suitable materials and reserving energy recovery for the remaining waste.
Leave a Reply