
Picking between aluminum and plastic feels simple—aluminum looks recyclable, plastic feels like trash. But the real answer is messier and more interesting than the materials themselves.
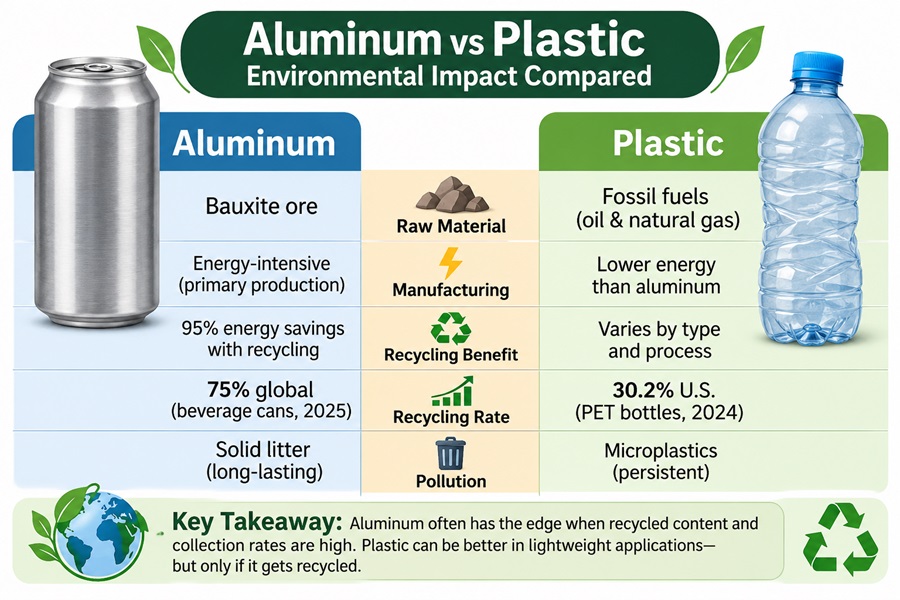
Global aluminum beverage can recycling hit 75% in 2025, far exceeding plastic’s 30.2% PET recycling rate. Yet primary aluminum production consumed 788 million metric tons of CO₂-equivalent last year, while recycling produced just 25 million. Plastic is lightweight, which saves transport emissions—but creates invisible chemical pollution as microplastics. Policy is reshaping the equation too. Deposit-return systems cut beverage litter by 66%, while EU mandates push both materials toward circular use.
The real winner depends on recycled content, your region’s collection system, and what happens after disposal. This article walks you through the tradeoffs with actual 2025 data.
Quick Answer: Is Aluminum Better Than Plastic?
Aluminum has a genuine edge when recycled.
Global aluminum recycling reached 75% for beverage cans in 2025, and recycling saves 95% of the energy needed for virgin production. That’s substantial. But primary aluminum (virgin) is energy-hungry. In the US, 80%+ of aluminum production is now secondary (recycled), which compounds the advantage—the infrastructure exists to capture that savings.
Plastic’s 30.2% recycling rate for PET bottles (2024) means most bottles become litter or landfill. Plastic is lighter and requires less material, which can reduce transport emissions. This advantage evaporates if the bottle isn’t recycled; then you have a problem that lasts centuries and fragments into microplastics.
Neither material is automatically better everywhere. Aluminum pulls ahead when recycled content is high, collection systems work, and the packaging reaches an end-of-life facility. Plastic can win in lightweight applications where transportation dominates the carbon footprint—but only if that bottle actually gets recycled.
Environmental Impact: The Full Picture
Carbon Footprint: It’s About Recycled Content
Here’s what changes everything: the source of the material and where it goes.
Primary aluminum (virgin) requires electrolysis at high heat. Global production hit 73 billion metric tons in 2024, generating 788 million metric tons of CO₂-equivalent. That’s the bulk of aluminum’s carbon footprint.
Recycled aluminum skips extraction and refining, cutting energy needs by 95%. In 2024, secondary production was just 25 million metric tons of CO₂-equivalent—a fraction of the primary impact.
The US now makes 80%+ of its aluminum from recycled material (up from <30% four decades ago), so the 95% energy savings applies to most production. But in regions relying on virgin aluminum, the carbon case for plastic strengthens—especially if it’s transported efficiently and actually recycled.
Plastic produces emissions during extraction (oil/gas), resin manufacturing, and production. Its weight advantage is real: a lighter bottle uses less fuel to transport than heavier packaging. But this advantage only matters if the bottle avoids landfill. If discarded, those manufacturing emissions are sunk costs with no recycling benefit.
The rule: Higher recycled content percentage = bigger aluminum advantage. Without collection systems, aluminum’s advantage disappears.
Recycling: Why Aluminum Wins at Scale
The recycling comparison isn’t close when you look at real-world rates.
How Recycling Works: Aluminum vs. Plastic
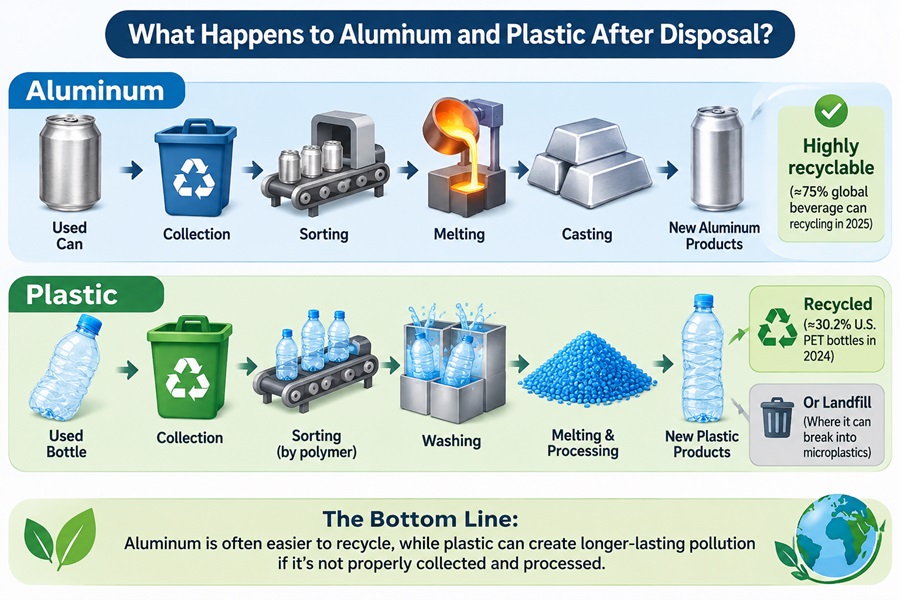
Aluminum is simple. Collect → sort → shred → melt → cast → manufacture new products. The metal retains its properties through infinite cycles. No degradation. No downcycling. Just aluminum in, aluminum out.
Plastic is complicated. Different polymers (PET, HDPE, PP, LDPE) have different melting points and properties. Sorting matters obsessively. Food residue, labels, mixed materials, and additives can degrade the final product. Mechanical recycling changes polymer structure, which is why some plastics downcycle—used once for bottles, next as lower-grade products, eventually as waste.
Result: Aluminum’s 75% global recycling rate (beverage cans, 2025) reflects collection infrastructure that works. Deposit-return systems (10 US states + EU law by 2029) drive these rates higher by rewarding recovery.
PET’s 30.2% rate (US, 2024) reflects fragmented collection. Most plastic ends up in mixed waste streams, contaminating recycling centers or being landfilled.
Policy Is Changing the Game
Recycling rates don’t happen by accident. They’re designed.
- EU mandate: 90% collection on metal containers by 2029; 25% recycled PET in beverage bottles by 2025, 50% by 2030
- California AB 793: Beverage makers must use 25% recycled PET by 2025, 50% by 2030—forcing plastic into circular systems
- Deposit-return systems: 10 US states + EU policy. Result: drink container litter is 66% lower in deposit regions (TOMRA, 2024). Aluminum benefits most because it’s economically valuable enough to collect
- Federal tax credits (US): Incentivize recycled content in both materials
Where policy is strong, aluminum’s advantage grows sharper. Without it, both materials become waste.
Pollution: Microplastics vs. Solid Litter
This is where plastic’s invisible problem surfaces.
Plastic litter doesn’t stay whole. UV exposure, wave action, and time break it into microplastics and nanoplastics—particles so small they’re ingested by organisms across soil, freshwater, and oceans. These microparticles bioaccumulate through food chains. Worse: they act as vectors for plastic additives and environmental pollutants. The plastic itself is toxic; what it carries is too.
Aluminum waste becomes solid litter. Discarded cans persist, dent, rust—but don’t fragment into microparticles. The harm is visible and localized, not biochemically distributed through ecosystems.
Neither outcome is good. But plastic’s invisibility and toxin-carrying capacity make it uniquely persistent. A single microplastic particle, carrying BPA and absorbed PCBs, can travel through a fish’s gills into human diets.
Where policy works: Deposit-return systems prevent both problems by ensuring collection. Regions with them see 66% less beverage container litter overall.
Recycling & Carbon Rates: 2025 Data
| Metric | Aluminum | PET Plastic | Source |
| Global recycling rate | 75% (beverage cans) | 30.2% (US bottles) | IAI/COP30 2025; NAPCOR 2024 |
| Energy savings when recycled | 95% vs. primary production | ~30-40% vs. virgin resin | IAI; US EPA |
| US production that’s secondary | 80% of total output | N/A | Mordor Intelligence 2024 |
| Collection advantage | High (deposit systems drive it) | Low (mixed waste streams) | TOMRA; regional data |
| Microplastics risk | None (inert material) | High (bioaccumulates) | Oregon DEQ; Britannica |
| Primary production (2024) | 788M metric tons CO₂e emitted | Varies by extraction method | Statista 2024 |
What About Food Packaging?
Both materials work for food; the choice depends on what you’re protecting and where it goes.
Aluminum Cans vs. Plastic Bottles
Aluminum blocks light and oxygen perfectly, extending shelf life for beverages. Strong barrier, proven track record.
Plastic (PET) is lightweight and convenient. Its barrier properties depend on bottle design; some work well, others allow oxygen permeation over time.
For beverages, the environmental difference comes down to recycling rates (aluminum 75% vs. PET 30%) and deposit eligibility (aluminum wins in deposit states). The barrier performance is equivalent for most drinks.
Other Food Packaging (Containers, Foil, Wrap)
For specialized uses—takeaway containers, foil, wrap—the same logic applies: recycling access and reuse potential matter more than material.
Aluminum foil: Often recyclable if clean and bundled, but small or food-stained pieces get rejected. Reusable containers made of aluminum last years.
Plastic wrap: Flexible and efficient for short-term storage, but rarely accepted in curbside recycling. Reusable containers degrade over time with washing.
The rule: Durability and reuse potential matter more than material choice. A durable aluminum container used 100+ times beats any single-use option regardless of material.
The Life Cycle: What Variables Actually Change the Outcome
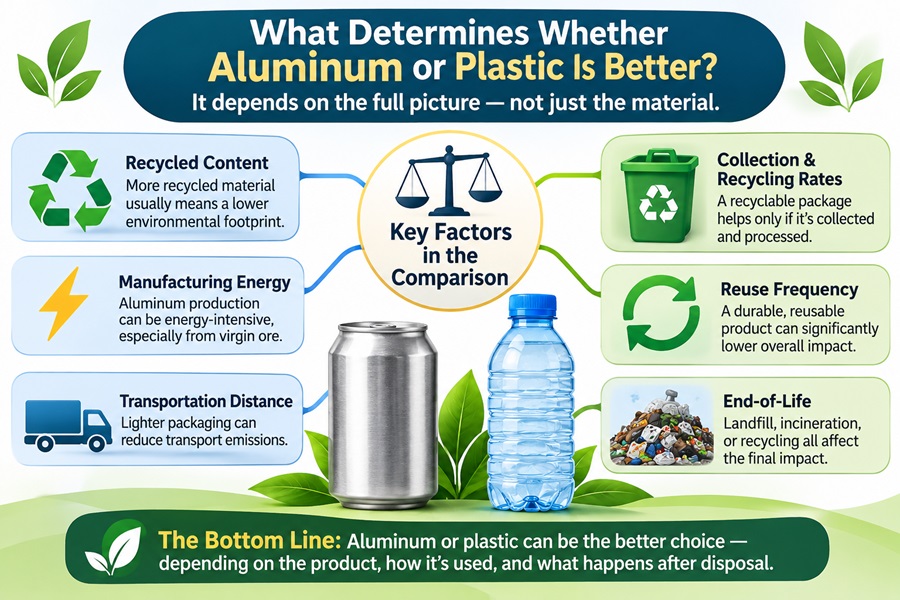
Saying “aluminum is better” oversimplifies. LCA (life-cycle assessment) outcomes flip based on several factors.
Recycled content percentage: An aluminum can made from 0% recycled material carries higher emissions than one at 75% recycled. The gap is massive. Most beverage cans in developed regions now use 50-75% recycled content, strengthening the case.
Transportation distance: Plastic’s weight advantage saves emissions on long-haul routes. A 10% lighter package might save enough CO₂ in transport to offset some production advantages. Regional sourcing matters.
Collection and end-of-life scenario: If aluminum isn’t collected, it’s just solid waste. If plastic is collected and recycled, it avoids landfill methane. If plastic becomes litter, microplastics enter ecosystems for centuries.
Reuse frequency: An aluminum water bottle needs 20-40 uses to break even with a plastic bottle’s lighter manufacturing footprint. With deposit-return systems driving high collection rates, that breakeven is achievable and often exceeded.
LCA bottom line: No universal winner. Only better choices for your region, product type, and whether collection infrastructure exists to capture the benefit.
How to Choose: Practical Guidance
Philosophy is useful. But here’s what actually matters when you’re making a purchase:
- Check your local recycling rules. Aluminum is accepted in most systems, but aluminum foil is often rejected (sticks to sorting machinery). Plastic acceptance varies by type. Call your local facility or check their website before assuming.
- Look for recycled content on the label. Aluminum typically ranges 40-75% recycled; premium brands exceed 75%. Plastic recycled-content labels are increasing (California AB 793 compliance). Higher percentage = larger environmental benefit.
- Verify deposit-return eligibility if your state/region has one. 10 US states have deposit systems. If your beverage container qualifies, collection rate jumps to 85%+. This transforms the equation.
- For plastic, prioritize PET (recycling code 1) or HDPE (code 2). These have established recycling streams. Other polymers have limited options.
- For reusables, choose based on durability. Will it survive 100+ washing cycles? Aluminum and glass generally outlast plastic. If you’ll actually use it that many times, the material choice becomes secondary.
- Reduce first. A package you don’t buy has zero environmental impact. Reuse when possible. Recycle when you can’t do either.
Aluminum vs. Plastic: The Final Verdict
Aluminum is the stronger environmental choice when:
- Recycled content is high (50%+)
- Your region has a collection system (deposit-return, curbside, or both)
- The package is actually recovered for recycling
- You’re comparing like products (aluminum can vs. PET bottle)
Plastic can win when:
- Lightweight design significantly reduces transport emissions
- The package is designed for a functioning recycling stream
- Higher reuse frequency or durability isn’t a factor
In practice: Where infrastructure exists (EU, North America deposit states, Australia), aluminum’s 75% recycling rate and 95% energy savings on recycled production make it the safer bet. Where it doesn’t (most developing regions, non-deposit US states), both materials struggle, and reduction/reuse become more important than recycling.
The material itself matters less than three things:
- How much recycled content is already in it
- Whether your local system will accept it
- Whether you’ll actually recycle it instead of discarding it
That’s where the environmental difference is actually made.
Key Takeaways
- 75% of aluminum beverage cans are now globally recycled (2025); recycling saves 95% of production energy vs. virgin aluminum
- Only 30.2% of PET bottles are recycled in the US; most become litter or landfill
- Microplastics fragment into bioaccumulating toxins; aluminum persists as inert solid waste
- Deposit-return systems reduce litter by 66% and transform recycling economics
- Policy (EU mandates, state deposit laws, tax credits) reshapes the comparison more than the materials themselves
- LCA outcomes depend on recycled content %, collection rates, and end-of-life scenario. No universal winner
Related Comparisons
Your packaging choice isn’t just aluminum vs. plastic. Explore how both compare to alternatives:
- Glass vs. Plastic — weight, recycling, and durability tradeoffs
- Paper vs. Plastic — emerging alternatives and compostability myths
- Reusable Packaging — when reuse breaks even environmentally
- Biodegradable & Compostable Plastics — what these labels actually mean
Frequently Asked Questions
Is aluminum better than plastic for the environment?
Not always. Aluminum’s recycling advantage is real (75% vs. 30%), but primary aluminum production is energy-intensive. Plastic can have a lower carbon footprint in lightweight applications. The equation shifts based on recycled content, regional collection systems, and policy.
Which has a lower carbon footprint?
Recycled aluminum: 95% lower than virgin. Virgin aluminum: comparable to or higher than plastic depending on transport. Plastic recycling: ~30-40% lower than virgin plastic. No universal answer without knowing the scenario.
Is aluminum easier to recycle than plastic?
Yes. Aluminum retains properties through infinite cycles; plastic degrades with each cycle. Aluminum recycling is simpler (one material); plastic requires sorting by polymer type. Aluminum’s 75% recycling rate reflects this advantage.
Why is aluminum more expensive than plastic?
Virgin aluminum requires energy-intensive production. Recycled aluminum is cheaper than virgin but more expensive than virgin plastic because plastic is subsidized below raw material cost in many markets. Volume and recycling infrastructure affect price more than inherent material cost.
Should I buy aluminum or plastic?
Check: (1) Does your local system accept it? (2) Is recycled content high? (3) Is it eligible for deposit-return? If yes to all three, aluminum is safer. If no to all three, neither material solves the problem—focus on reducing purchases instead.
What about food safety?
Both materials are safe for food when used as designed. Check manufacturer instructions for temperature limits. Food quality depends on storage conditions (temperature, humidity, light), not the packaging material alone.
Leave a Reply