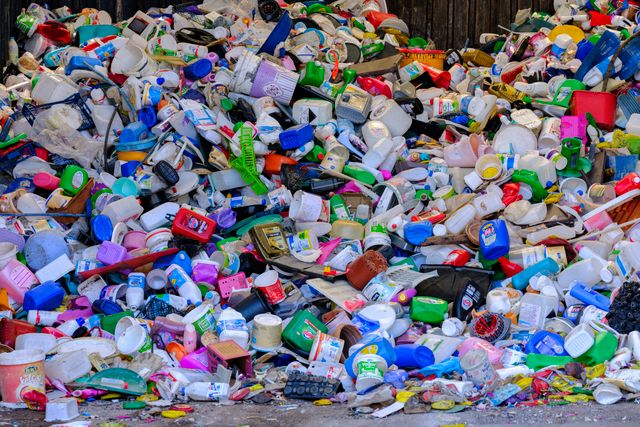
Recycling works best when the collection stream contains the materials a local program is designed to accept. Items that do not belong in the bin can damage equipment, lower the quality of recovered materials or create safety risks.
Every time you put a plastic bag in your recycling bin, or rinse a yogurt container halfway and toss it in, or throw a pizza box with grease stains into the mix, you’re introducing contamination. A single plastic bag can wrap around machinery and shut down an entire Material Recovery Facility for hours. Food residue spoils entire bales of otherwise good paper. Hazardous materials like batteries and propane tanks create genuine safety crises.
Contamination is a real operational problem, but there is no single percentage that describes every single-stream program. Rates differ by location, collection rules, audit method and material mix. It is also important to distinguish contamination (unwanted material in the recycling stream) from capture rate (the share of recyclable material that residents actually put out for collection).
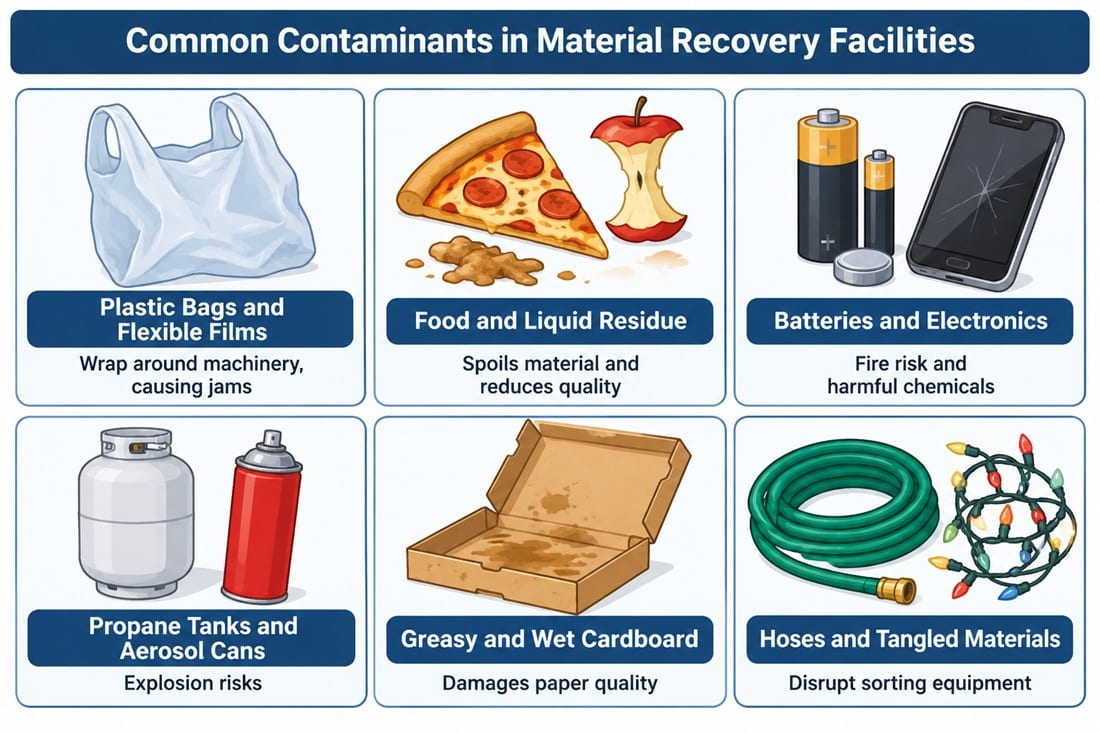
What Counts as Contamination?
Contamination isn’t just “stuff that shouldn’t be there.” It’s anything that makes sorted material unmarketable or that disrupts the sorting process itself.
Hard contaminants (the obvious ones):
Plastic bags and film — wrap around rotating machinery, jam sorters, cause shutdowns
Propane tanks and aerosol cans — explosion and fire hazards
Batteries and electronics — contain toxic materials and pose fire risks
Needles and medical waste — injure workers
Hoses, string lights, and tanglers — get wound around equipment shafts
Paint cans and hazardous chemicals — contaminate entire bales
Soft contaminants (the quality killers):
Food residue — spoils paper, makes plastics unmarketable, attracts pests
Greasy pizza boxes — paper fiber breaks down, reduces pulp quality
Wet cardboard — breaks apart in sorting machinery
Labels and adhesives — reduce plastic value for reprocessing
Mixed materials taped together — can’t be separated mechanically
Non-recyclable plastics — (#3, #6, #7 in many systems) get sorted but have no buyer
Process contaminants (the invisible ones):
Misidentified materials — dark plastics that optical sorters can’t read; films that bypass identification
Degraded materials — plastics that have been recycled multiple times lose structural integrity
Incompatible materials — like glass in a plastic-only stream (quality falls below buyer specs)
The Scale of the Problem
Contamination rates: how they are calculated
An inbound contamination rate should be measured from a representative sample taken before sorting. The auditor separates the sample into materials accepted by the local recycling program and materials that are not accepted, weighs each category, and applies this calculation:
Inbound contamination rate (%) = (weight of non-accepted material ÷ total weight of the inbound sample) × 100
For example, if a 500 kg sample contains 75 kg of non-accepted material, the inbound contamination rate is 15% (75 ÷ 500 × 100). This is an illustrative calculation, not a measured result from a named facility.
The definition of “non-accepted material” must follow the local program’s written rules. Auditors should state how they treat moisture, food residue, glass fines, hazardous items and materials that are technically recyclable but not accepted by that collection program. Use representative samples, record the date and source of each load, and apply the same categories across audits.
Do not confuse three different measurements
Inbound contamination: the weight of non-accepted material in a sample of incoming recyclables divided by the total sample weight. This measures what arrives at the facility.
MRF residue rate: the weight of material sent to disposal after processing divided by the total inbound mass over the same period. This measures what the facility sends to disposal. It can include recyclable material lost during sorting or material with no available market, so it is not the same as an inbound contamination audit.
Outbound bale contamination: the amount of unwanted material found in a recovered commodity bale. It is assessed against the buyer’s specification and is not the same as either inbound contamination or the facility’s total residue rate.
These figures should not be compared as if they measure the same thing. Oregon’s Department of Environmental Quality explains that inbound characterization audits and post-processing residue calculations use different numerators and can produce results that are not directly comparable.
What published MRF data actually shows
A University of Florida study prepared for the Florida Recycling Partnership Foundation examined historical data from 10 of Florida’s 26 municipal solid waste recycling MRFs. It reported a historical average of 25% of total inbound mass sent to landfill: 27% for single-stream MRFs and 18% for dual-stream MRFs. The data covered different years between 2007 and 2019; not every facility supplied data for every year.
Important qualification: the Florida study defined its “contamination rate” as the share of inbound mass landfilled after processing. That measure includes not only non-recyclable items, but also material such as glass that was landfilled when markets were unavailable and recyclable material lost during sorting. It is therefore best described as a historical MRF landfill-residue measure—not a direct estimate that one-quarter of incoming material was non-recyclable. It is not a current national or global average.
The study is a documented example of how much inbound material some facilities sent to landfill under the study’s definition. It does not justify a universal “25–35% contamination rate.” A local inbound audit is needed to establish the contamination rate for a particular program or facility.
Capture is a separate measure from contamination. The Recycling Partnership’s 2024 State of Recycling report estimates that only 21% of recyclable material in the U.S. residential waste stream is captured for recycling. This is a system-wide capture measure, not a claim that 79% of material collected by MRFs is contaminated.
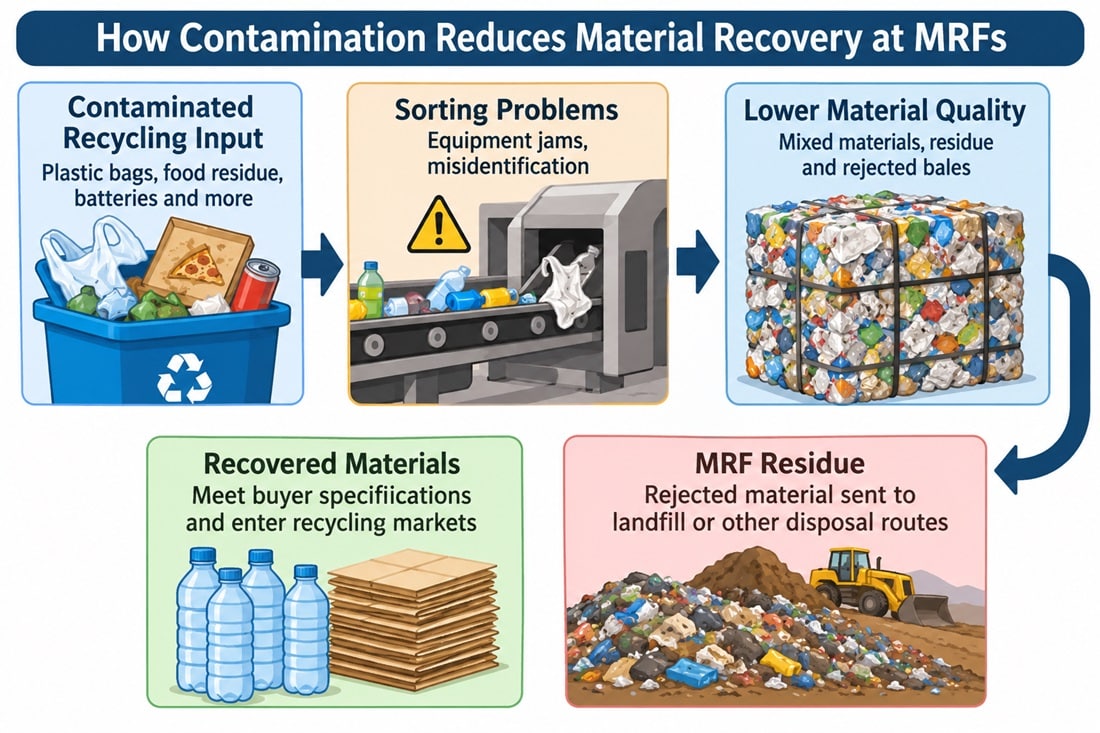
Why Contamination Matters: The Cascading Damage
Contamination doesn’t just reduce the amount of material recovered. It creates a domino effect throughout the facility and downstream.
- Equipment Downtime and Safety Hazards
A plastic bag wrapped around a sorting machine’s rotating shaft isn’t just an inconvenience — it’s a shutdown. Workers have to climb into machinery (sometimes while it’s still running), cut out the tangled material, and restart the equipment. This costs time, money, and occasionally results in serious injuries.
Propane tanks and batteries that slip into loads create genuine safety emergencies. Lithium-ion batteries can ignite spontaneously inside bales or on conveyor lines. A single fire in an MRF can force evacuation and shut down operations for days while investigators determine what went wrong.
- Reduced Sorting Efficiency
When the input stream is heavily contaminated, optical sorters and manual pickers spend time trying to identify materials that should never have been in the bin in the first place. Resources are diverted away from actually sorting recyclables.
Contaminated inputs also reduce the accuracy of automated systems. Optical sorters train on clean plastic samples, but when they encounter food-soiled, degraded, or mixed plastic, they misidentify it. The machine shoots the item into the wrong chute, and it ends up in residue anyway.
- Lower Quality Outputs
PET plasticThis is what buyers care about most. A bale can contain mostly one polymer and still fail a buyer’s specification if it includes incompatible plastics, film, metals, moisture or excessive residue.
Contaminated outputs may be rejected, downgraded or sent back for further sorting. The commercial impact depends on the commodity grade and the buyer’s written specification.
- Market Volatility Amplification
Commodity markets for recycled materials are already volatile — bale prices swung dramatically between 2021 and 2024. High contamination rates make that volatility worse. When buyers receive inconsistent quality, they either reject batches outright or demand discounts. This cuts into MRF revenue precisely when market prices are already down.
The Real Culprit: Single-Stream Convenience vs. Quality
This is where the story gets complicated.
Single-stream recycling — putting everything in one bin — was invented to increase participation. And it worked. Residential recycling rates jumped when single-stream programs rolled out because the system is convenient for households.
But convenience and quality are in direct conflict.
Separating some materials before collection can reduce cross-contamination and make sorting easier, but results depend on local program design, participation and collection costs. A multi-bin system is not automatically better in every community; its performance should be assessed against the actual materials collected and the quality of the outputs.
The catch: most households won’t use them. Multi-bin systems require education, attention, and effort. People like the simplicity of tossing everything together.
So the waste industry made a choice: optimize for participation at the expense of quality. The result is single-stream recycling, which works only because MRFs absorb the inefficiency cost.
The Contamination Feedback Loop
Here’s where it gets worse.
As contamination rates climb, MRF operating costs rise (more time removing contaminants, more equipment breakdowns, lower quality outputs). Simultaneously, buyer quality standards get stricter (because they’re receiving dirtier material). MRF margins compress.
In response, many facilities cut corners:
Reduce manual sorting staff → more contamination gets through
Skip quality control inspections → inconsistent output
Lower throughput speeds → try to catch more contaminants, but increase bottlenecks
Close facilities → consolidate operations, reducing local collection options
When MRFs close, communities lose recycling infrastructure. Material that would have been sorted now goes to landfills or incinerators by default.
This creates political pressure to blame the system (recycling doesn’t work, MRFs are a waste) rather than the real issue (contamination at the source).
What Actually Gets Through?
To understand contamination impact, it helps to know what percentage of sorted material actually makes it to market.
Cleaner, source-separated inputs generally give facilities a better chance of producing marketable material.
Clean, well-separated inputs generally give facilities a better chance of producing marketable material.
The remaining rejects depend on the material mix, collection rules and buyer specifications.
Mixed single-stream inputs can require more sorting and can produce more rejects than source-separated streams.
A mixed single-stream input can require more sorting and can produce more rejects than a source-separated stream.
The quantity of residue must be measured at the facility; there is no universal percentage.
Highly contaminated inputs can increase rejects substantially. The result should be measured through a local material audit.
A high-contamination stream can produce substantially less saleable material, but the result must be measured at the facility.
Highly contaminated inputs can increase rejects substantially, but results vary and should be reported from a local audit.
That residue goes somewhere. Most goes to landfills. Some gets sent to waste-to-energy facilities. A tiny fraction enters chemical recycling or alternative processing. But whatever happens, it’s no longer recycled — it’s waste.
The Hidden Cost: Who Really Pays?
MRF operations are funded by:
Commodity sales (bale prices for sorted materials)
Tipping fees (charges per ton for accepting waste)
Processing fees (contracts with waste management companies for sorting services)
When contamination climbs, bale prices fall (lower quality, less marketable). This hits MRF revenue hard, especially facilities that rely more on commodity sales than fixed fees.
Tipping fees or processing fees rise to compensate, which gets passed on to residents through higher trash and recycling collection costs. So contamination in your bin eventually increases your garbage bill.
Additionally, municipalities invest in education campaigns (“rinse your containers,” “no plastic bags”) that produce minimal behavioral change. Education alone rarely fixes every contamination problem. Clear local instructions work better when collection rules are consistent, accepted materials are easy to identify and residents have convenient ways to dispose of batteries, films and other excluded items.
Solutions: Upstream vs. Downstream
The recycling industry debates two approaches to contamination: fix it downstream (better technology at MRFs) or fix it upstream (prevent contamination at the source).
Downstream Fixes (Modernizing MRFs)
Optical sorting and AI-assisted detection can help identify target materials, but performance depends on the input stream, equipment configuration and test method. These systems do not remove food residue from containers or make hazardous items safe.
Robotic picking systems can sort materials humans miss, but robots are expensive (hundreds of thousands per unit) and require constant retraining as input composition changes.
Better screening and air classification can separate contaminants by density, but the most contaminating items (plastic bags, food, hazardous materials) behave unpredictably.
Reality check: Better technology helps, but it can’t reverse contamination that happens at the bin. You cannot engineer around fundamental user behavior through sorting alone. No machine can extract the pasta from inside a food container that made it past the tipping line.
Upstream Fixes (Preventing Contamination at Source)
Deposit-return systems can create a separate collection route for beverage containers and may produce a cleaner, more consistent feedstock. The outcome depends on the scheme’s coverage, return convenience, container rules and sorting arrangements; do not assume one contamination rate applies to every program.
Multi-bin collection systems work in places with strong waste management culture (Germany, Sweden, Japan), but require ongoing enforcement and education.
Design for recyclability initiatives push manufacturers to make packaging with no adhesives, consistent materials, and no incompatible layers. A yogurt container designed to be easily disassembled is less likely to contaminate a batch of plastic.
Consumer education — while studied extensively — produces only marginal improvements in real-world behavior. Knowing what you should do and actually doing it are different things, especially when the system is deliberately designed to be convenient rather than correct.
The Uncomfortable Truth
Fixing contamination requires accepting that single-stream recycling has inherent limits. You can’t sort your way out of a system designed to be convenient at the expense of quality.
Useful responses combine convenient collection rules, deposit-return systems for eligible containers, separate routes for difficult materials, better packaging design and targeted public information. The right mix depends on local infrastructure and costs.
Where collection systems remain highly mixed or local rules are unclear, contamination can challenge MRFs. The scale of the problem must be established with a clearly defined audit; residue figures and inbound contamination figures should not be treated as interchangeable.
That does not mean recycling is pointless. It means the system needs realistic collection rules, better product design, reliable end markets and transparent reporting about what is actually recovered.
What You Can Actually Do
If you want to reduce your personal contamination impact:
Check your local MRF’s specific guidelines — not all accept the same materials. Contamination starts with confusion about what’s actually recyclable in your system.
Empty containers and remove obvious food residue where practical. Follow local instructions; a quick rinse is not always required, and a small amount of residue does not mean every item will automatically be rejected.
Keep plastic bags and flexible film out of curbside bins unless your local program explicitly accepts them. Some retailers and specialist recyclers run separate film collection schemes. Compostable bags also belong only in a collection system that specifically accepts them.
Keep hazardous items out — batteries, electronics, propane tanks, and needles absolutely cannot go in recycling, even if you think they should be.
Question the system — if single-stream recycling is the only option in your area, consider pushing for deposit systems (especially for beverages) or multi-bin programs. Contamination won’t improve without changing the fundamental system.
What Happens Next?
To see what happens to material rejected during sorting, read the guide to MRF residue and its possible destinations, including landfill and waste-to-energy treatment.
And if you’re wondering whether this economic pressure forces facilities to close and communities to lose recycling options, learn more about the business side: read MRF Economics — Why Facilities Close & Profitability Models.
Recent developments and what they mean for MRFs
Recent data helps clarify a common misunderstanding: contamination and capture are not the same metric. The Recycling Partnership’s 2024 State of Recycling report estimates that U.S. households capture only 21% of recyclable material in the residential waste stream. This is a system-wide capture measure, not a claim that 79% of MRF input is contaminated. The distinction matters when diagnosing whether the main problem is access, participation, sorting or material quality.
Battery safety is another growing concern for MRFs. The U.S. EPA says lithium-ion batteries and devices containing them should not go in household garbage or recycling bins because they can be damaged during collection and processing and start fires. Residents should use designated battery or household hazardous-waste collection points instead.
Sources and further reading
The Recycling Partnership, 2024 State of Recycling report.
U.S. EPA guidance on lithium-ion battery disposal.
Related guides on PlasticSolutionsReview
How material recovery facilities work | MRF residue | MRF economics
Editorial note: Recovery rates, contamination levels, commodity prices and facility costs vary by location, date, material grade and contract. Where no comparable public dataset exists, this article avoids presenting a universal figure.
Leave a Reply