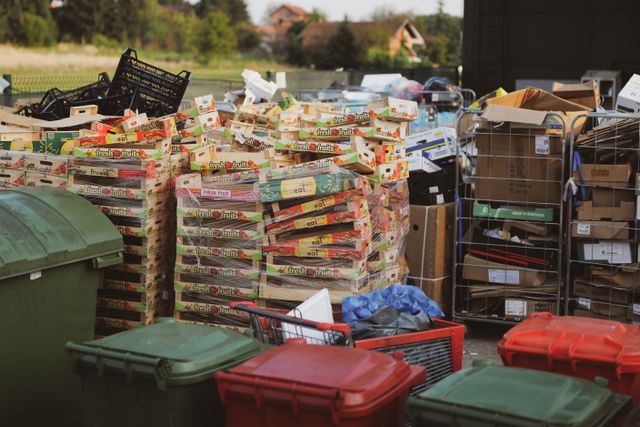
You’ve learned how MRFs work and why contamination breaks the system. But here’s the question nobody asks: what happens to the material that doesn’t get recycled?
MRFs generate residue when material is too contaminated, too small, too mixed, unsuitable for the equipment or not marketable to a buyer. The amount varies widely with the incoming stream, facility design, sorting performance and local markets. Avoid applying one residue percentage or daily tonnage to every facility.
That’s not a minor byproduct. That’s a massive waste stream that needs to go somewhere. And where it goes — landfill, incineration, or emerging technologies like chemical recycling — shapes the economics, environmental impact, and political viability of the entire recycling system.
What Exactly Is MRF Residue?
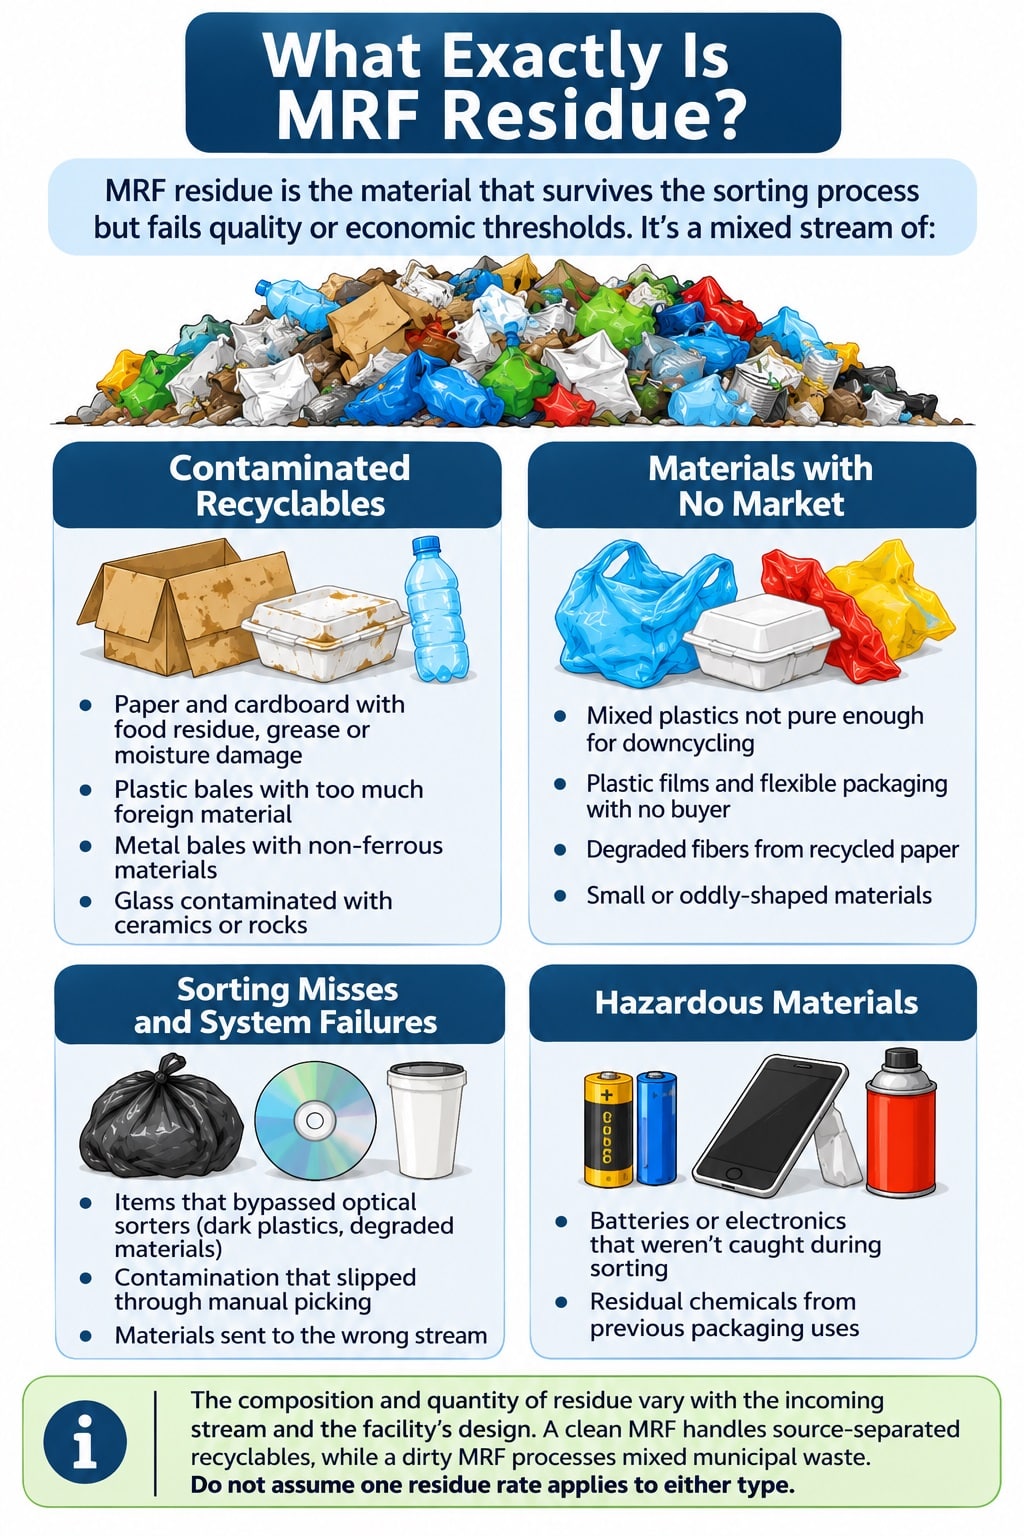
MRF residue is the material that survives the sorting process but fails quality or economic thresholds. It’s not one thing — it’s a mixed stream of:
Contaminated recyclables:
Paper and cardboard with food residue, grease, or moisture damage
Plastic bales that exceed the buyer’s permitted level of foreign material
Metal bales that include non-ferrous materials mixed in
Glass contaminated with ceramics or rocks
Materials with no market:
Mixed plastics that are neither high enough purity nor valuable enough for downcycling
Plastic films and flexible packaging that got sorted but have no buyer
Degraded fibers from paper recycled multiple times
Small or oddly-shaped materials that couldn’t be baled economically
Sorting misses and system failures:
Items that bypassed optical sorters (dark plastics, degraded materials)
Contamination that slipped through manual picking
Materials that were misidentified or sent to the wrong stream
Hazardous materials that made it past tipping lines:
Batteries or electronics that weren’t caught during initial sorting
Residual chemical contamination from previous packaging uses
The composition and quantity of residue vary with the incoming stream and the facility’s design. A clean MRF handles source-separated recyclables, while a dirty MRF attempts to recover materials from mixed municipal waste. Do not assume one residue rate applies to either type.
Where Does Residue Go? The Three Pathways
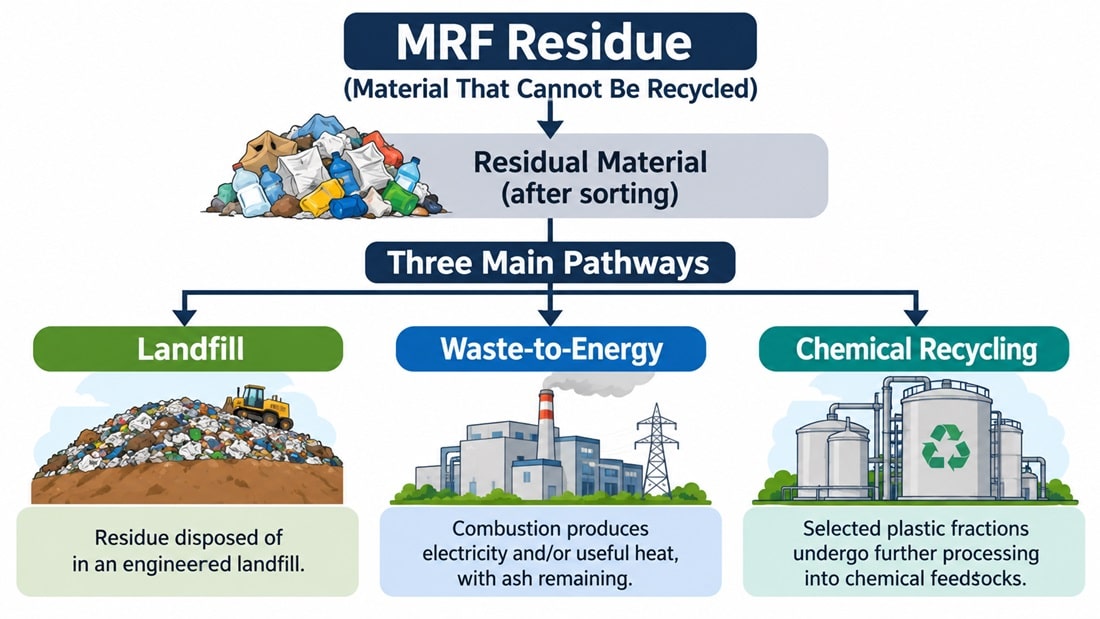
Pathway 1: Landfills (The Default)
Landfill disposal is one common route for MRF residue, especially where landfill capacity is available and other treatment options are limited. However, the share sent to landfill varies by region, contracts, regulation and access to waste-to-energy facilities. There is no reliable universal split that applies to all MRF residue.
Where landfilling is available, it may be the most practical or lowest-cost disposal route. Actual costs depend on local landfill fees, transport distance, taxes, contract terms and the type of residue. Use local data rather than a broad price range when making a cost comparison.
From a revenue perspective, this is a loss. The facility paid to accept the mixed recyclables (tipping fees from haulers), invested labor and equipment costs to sort it, and still has to pay again to dispose of the residue. Every ton of residue is money out the door.
The environmental cost is significant. Material that was supposed to be recycled — and that residents believed they were recycling — ends up in a landfill where it will sit for decades. Paper that could have become new cardboard boxes now takes up landfill space. Plastic that could have been reprocessed now contributes to the growing mound of persistent waste.
Landfills are engineered facilities with liners, leachate collection and gas-management systems, although performance and controls vary. Organic material in landfills can generate methane as it decomposes without oxygen. The climate impact depends on how much methane is generated, captured, oxidized or released; avoid implying that all residue directly causes groundwater contamination.
Public trust can suffer when residents discover that some collected material is rejected. Clear reporting helps: communities should distinguish material collected, material sorted into saleable commodities and material ultimately recycled by a reprocessor.
Pathway 2: Waste-to-Energy Incineration
The second pathway for MRF residue is waste-to-energy (WtE) incineration — burning material at high temperatures to generate electricity and heat, while capturing some of the emissions through pollution controls.
Why residue goes here instead of landfill:
Energy recovery can produce electricity and/or useful heat from residual waste, but output depends on the waste’s composition, moisture, heating value and plant efficiency. Do not use a single kWh-per-ton figure without a named facility or study.
It reduces landfill volume (which is politically popular in regions with limited landfill capacity)
For operators in certain regions, it’s economically comparable to landfilling once you factor in tip fees and transportation
The environmental calculus is complicated. WtE facilities do capture methane that would otherwise be produced in landfills, and they generate electricity that displaces fossil fuels. Life-cycle comparisons between landfill and energy recovery depend on waste composition, landfill-gas capture, plant efficiency, energy displaced and emissions controls. A result from one study or location should not be generalized to all facilities.
But there’s a catch: WtE facilities are expensive to build and operate, they produce air emissions (some facilities are older and don’t have modern pollution controls), and they create ash residue that still needs to go to landfills.
Some regions send residual waste to waste-to-energy plants, while others rely mainly on landfills. The mix is strongly shaped by local infrastructure, policy, transport costs and contracts. Do not present an unverified national percentage.
The incentive structure varies. Some contracts reward lower residue or higher-quality bales; others pay mainly for throughput. The payment model affects whether a facility gains financially from investing in better sorting.
Pathway 3: Chemical Recycling & Emerging Technologies
MRF residue A possible route for selected residual plastics is chemical processing, including pyrolysis, gasification or depolymerization. These processes differ in their feedstock requirements and outputs; they do not accept every mixed residue stream.
Some chemical processes use heat, solvents or other methods to break selected polymers into smaller molecules or chemical feedstocks. The process, temperature and output depend on the technology.
In pyrolysis, selected plastic feedstocks are heated in an oxygen-limited or oxygen-free environment. Operating conditions vary by process and feedstock.
The polymer chains break down into smaller molecules (pyrolysis oil or syngas)
These molecules are then refined or polymerized into new plastic feedstock
These technologies may offer routes for selected plastic fractions that are difficult to process mechanically, but they require suitable feedstock and further processing.
It can process contaminated, mixed, or degraded plastics that no traditional recycler will accept
Some chemical processes can produce feedstocks that may be used to manufacture new polymers, but the output requires further processing and quality control. It is not automatically equivalent to virgin resin, and the environmental and economic case depends on yields, energy use, emissions and the actual end product.
It’s theoretically applicable to plastic types (#3–#7) that mechanical recycling can’t handle
The reality check:
Some chemical-recycling processes have moved beyond laboratory research into commercial or demonstration operations, but maturity varies by technology and facility. A plant’s existence does not prove that it can process all mixed MRF residue economically or at high yield.
Capital costs can be high, but they vary by technology, scale, feedstock preparation, site requirements and environmental controls.
Energy inputs are substantial — pyrolysis isn’t free
They’re economically viable only with significant subsidies, carbon pricing, or extended producer responsibility (EPR) mandates
Environmental benefits depend entirely on the energy source (a coal-powered pyrolysis facility is worse than landfilling; a renewably powered one is better)
There is no robust global dataset establishing what share of MRF residue is processed through chemical recycling. Treat forecasts as scenarios, not established outcomes. The European Commission’s Joint Research Centre continues to assess the economics, maturity and limitations of pyrolysis and solvolysis.
The Residue Economics: Why It Matters
Understanding where residue goes requires understanding the business incentives.
Cost Structure
An MRF facility’s revenue comes from:
Commodity sales (bale prices for sorted materials) — volatile, currently depressed
Tipping fees (payments for accepting waste) — stable but relatively small
Processing fees (contracts with municipalities/haulers) — stable but margin-thin
Residue disposal costs come from:
Landfill tipping fees — vary by region, waste type and contract
Transportation — depends on distance, vehicle type and contract
Operational costs (labor for residue handling) — built into facility overhead
Residue disposal can become a major operating expense, particularly for facilities with high reject volumes or long transport distances. A sound cost estimate needs measured residue tonnage and local disposal and transport rates.
When commodity prices fall, disposal costs can take a larger share of the revenue generated by recovered materials. The impact depends on the facility’s material mix and contract structure.
The Perverse Incentive
Whether a facility has a financial incentive to reduce residue depends on its contracts and payment model. Avoided disposal fees and better-quality bales can reward improved sorting, but capital and operating costs may outweigh those gains.
Reducing residue can save disposal costs and improve commodity quality, but whether those gains cover an investment depends on the equipment cost, contract structure, material prices and the amount of additional material that has a real buyer. The better sorting might improve the quality of output bales (which could increase commodity prices slightly), but that’s a marginal benefit.
A facility may still receive an acceptance or processing fee for incoming material, but whether that fee covers the cost of handling residue depends on the contract. Poor sorting can also reduce commodity revenue and raise disposal costs.
Contract incentives differ. Some agreements reward higher-quality outputs or lower residue; others pay mainly for throughput. The payment structure can influence how much a facility gains from investing in better sorting.
The Policy Lever
The only thing that shifts this incentive is Extended Producer Responsibility (EPR) — policies that make the companies that designed and manufactured the packaging financially responsible for end-of-life management.
MRF residue A well-designed EPR scheme can make producers contribute to collection and treatment costs and can use fee structures to reward packaging that is easier to collect and recycle. The details vary by jurisdiction.
Several U.S. states and the EU are implementing EPR programs, but they’re still new and incomplete. Most programs focus on collection and sorting infrastructure, not necessarily on reducing residue or incentivizing zero-contamination-by-design.
Lifecycle Comparison: Is Any Pathway “Better”?
This is where the environmental comparison gets complex. Better for what? Better for whom?
Landfill
Pros:
Cheapest immediate disposal option
Land-based, relatively stable
Material is stabilized over decades (though this isn’t a benefit, it’s just what happens)
Cons:
Persistent waste — material will sit for centuries
Methane production from organic matter
Potential leachate and groundwater risks depend on landfill design, operations and monitoring.
Visual/political impact (“our recycling is being landfilled”)
Opportunity cost — material that could have been recovered is lost
Net climate impact: Moderate to high negative (depending on methane capture at the landfill)
Waste-to-Energy
Pros:
Can recover some energy; actual output depends on waste composition and facility efficiency.
landfills May avoid some landfill methane, but the climate result depends on the waste stream, plant efficiency, pollution controls and the energy displaced.
Reduces physical landfill volume (politically valuable in space-constrained regions)
Existing infrastructure (mostly built out in Northeast and Europe)
Cons:
Air emissions (modern facilities capture most, but not all)
Ash residue still needs disposal (typically landfilled or used as aggregate)
Energy recovery depends on facility design, waste heating value and operating efficiency.
Technology is capital-intensive and aging in many regions
Creates incentive for more waste (fuel demand)
Net climate impact: Slightly positive vs. landfilling, but negative vs. waste prevention
Chemical Recycling (Pyrolysis/Gasification)
Pros:
Can process contaminated, mixed, and degraded plastics
Produces virgin-quality material (no downcycling)
Theoretically closes the loop (plastic to plastic, not plastic to landfill)
Lower air emissions than WtE
Cons:
High energy inputs (depends entirely on energy source)
Expensive capital and operations
Still mostly pilot/demonstration phase
Energy-intensive (net climate benefit only with renewable energy)
Creates incentive to design non-recyclable packaging (“let pyrolysis handle it”)
Net climate impact: Potentially positive, but highly dependent on energy source and facility efficiency
The Uncomfortable Reality
MRF residueEach disposal or treatment route has trade-offs. The best first step is to prevent avoidable residue by improving product design, collection quality and sorting; the remaining material still needs a safe, regulated destination.
This means:
Design packaging that’s actually recyclable (not just theoretically — practically, with real equipment, no contamination)
Implement upstream contamination prevention (deposit systems, multi-bin collection, consumer education that actually works)
Accept lower recycling participation rates in exchange for higher output quality (e.g., fewer households recycling at higher purity is better than many households recycling at low purity)
But none of those happen at scale because they conflict with consumer convenience and corporate packaging design profits.
landfillsThe destination depends on the local waste system. Some regions rely mainly on landfill, others use energy recovery, and a smaller number have access to specialist treatment routes. Reported shares should be tied to a specific region and dataset.
What This Means for the Recycling System
MRF residue is the system’s dirty secret. It’s the material that proves recycling isn’t working as advertised, but it’s invisible to most people.
For policymakers: expanding sorting capacity without addressing collection quality, packaging design and end markets can leave the same system bottlenecks in place. Facilities need clean inputs and viable destinations for recovered materials.
For facility operators: It means margins are thin and getting thinner. The profitability of recycling depends entirely on commodity prices (which you can’t control) and input contamination rates (which residents won’t improve). Many operators are consolidating or exiting the business.
For consumers: It means that putting something in a recycling bin doesn’t guarantee it will be recycled. The system’s capacity to absorb contamination is finite, and we’ve exceeded it.
For manufacturers: It means there’s a growing financial and reputational incentive to design packaging that won’t become residue. But since EPR policies are still weak and enforcement is loose, this incentive remains theoretical.
The Path Forward
Reducing residue requires systemic change, not just technological optimization:
EPR with teeth — Make producers financially liable for residue, not just collection. This changes design incentives.
Deposit systems for high-value items — Beverages, for example, produce exceptionally clean container streams when deposits are involved.
Material standardization — Limit the types and formats of packaging in circulation, which reduces sorting complexity and contamination.
Transparency — MRFs should publicly report residue rates and destinations. Accountability drives change.
Waste prevention — The most effective way to reduce residue is to generate less packaging in the first place.
What Comes Next?
You now understand the full MRF journey: how material is sorted, why contamination undermines the system, and where rejected material ends up. But the economic forces driving these outcomes run deep.
Explore MRF Economics — Why Facilities Close & Profitability Models to understand why margins are collapsing and what would need to change for recycling to be genuinely sustainable. Or dive into Waste-to-Energy to examine whether burning residue is actually a climate solution or just another form of waste.
Recent developments and what they mean for MRFs
Recent evidence on chemical recycling reinforces the need for caution. A 2026 European Commission Joint Research Centre assessment examined the economics of pyrolysis and solvolysis in the EU. It found that these routes face cost and maturity challenges and do not currently reach cost parity with virgin plastics. Their role depends on the feedstock, process performance, energy use, output quality and policy requirements; they should not be described as a ready-made solution for all MRF residue.
The EU Packaging and Packaging Waste Regulation began applying on 12 August 2026. It sets a broader framework for packaging prevention, recyclability, recycled content and waste management, with further technical rules scheduled over time. For MRFs, this matters because packaging design and sorting requirements are increasingly shaped by regulation upstream of the facility.
Sources and further reading
- European Commission Joint Research Centre assessment of chemical recycling economics
- European Commission overview of the Packaging and Packaging Waste Regulation
- UNEP report on system-wide plastics solutions
Related guides on PlasticSolutionsReview
How material recovery facilities work | contamination in MRFs | plastic landfills | waste-to-energy | incineration
Editorial note: Recovery rates, contamination levels, commodity prices and facility costs vary by location, date, material grade and contract. Where no comparable public dataset exists, this article avoids presenting a universal figure.
Leave a Reply