
MRF operators face a difficult combination of volatile commodity prices, operating costs, capital needs and changing input quality. Some facilities have closed, consolidated or changed contracts, but the scale and causes of closures vary by market. Avoid an unsupported continent-wide closure count.
Understanding why requires looking at the numbers. Most people assume recycling facilities make money by selling recycled materials — and they do, technically. But the economics are so fragile that a single commodity price swing can turn a profitable operation into a money-losing crisis.
This is the story of why the recycling infrastructure that communities depend on is increasingly unreliable, and what would have to change to make it sustainable.
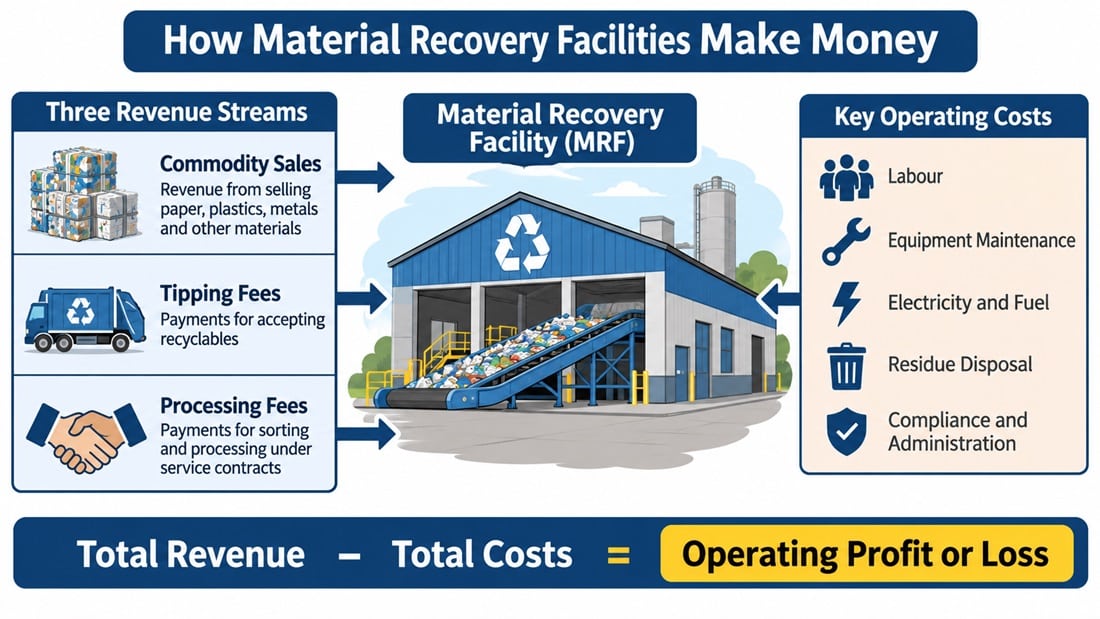
The Revenue Problem: Three Income Streams That Don’t Add Up
An MRF’s revenue comes from three sources. The problem is that only one of them is reliable, and it’s also the smallest.
Revenue Stream 1: Commodity Sales (Volatile, High Volume, Low Margin)
This is the headline number — the price you get for a bale of sorted plastic, aluminum, or paper. It’s also the most unstable revenue source.
How it works: An MRF sorts material into commodity bales and sells them to reprocessors, mills, or recyclers. Bale prices are not fixed benchmarks. They vary by grade, contamination, region, delivery terms, buyer demand and date. Any price comparison in this article should name the market, grade, source and month; otherwise, explain the revenue mechanism without quoting a current price.
These prices fluctuate based on global supply and demand. When plastic is abundant and recycled material competes with cheap virgin plastic (made from oil), prices crash. Recycled-material prices can move sharply as virgin resin prices, import competition, manufacturing demand and quality requirements change. A price series should be tied to a specific polymer grade and market rather than described as a universal price for recycled plastic.
Why it’s unstable:
Virgin resin prices can influence demand for recycled plastic, but the relationship is not one-to-one. Recycled-material prices also depend on quality, policy, buyer commitments and supply.
- Global supply of recycled materials floods the market when multiple countries ramp up collection
- Demand from end-markets fluctuates with manufacturing cycles and consumer spending
- Currency exchange rates matter (when the dollar strengthens, U.S. exports become less competitive)
Contamination directly affects price: buyers may discount or reject bales that do not meet grade specifications. The discount depends on the material and contract.
Commodity-price changes can materially affect a facility’s revenue, but the impact depends on its material mix, contract structure, inventory and sales arrangements. A facility with fixed processing fees faces a different exposure from one that owns and sells the recovered bales.
A simple model can show how the economics work without pretending there is one typical MRF. Multiply each material grade’s saleable tonnage by its actual realized selling price, then add contracted tipping and processing fees. Subtract labor, maintenance, utilities, residue handling, compliance, administration and financing costs.
Revenue Stream 2: Tipping Fees (Stable, Small Amount)
This is the fee MRFs charge to municipalities or waste haulers for accepting mixed recyclables. It’s the one reliable income stream because it’s not commodity-dependent.
Tipping fees are negotiated locally and depend on competition, transport, facility capacity, contract terms and the quality of incoming material.
For illustration, annual tipping-fee revenue can be estimated as accepted tonnes multiplied by the contracted fee per tonne. Use the facility’s actual throughput, operating days and contract rate.
Tipping fees can provide a steadier revenue base than commodity sales, but whether they cover operating costs depends on the contract and facility design.
The complication: municipal and hauler contracts can run for several years, but terms differ. A contract signed before a market downturn may leave the operator or municipality carrying more price risk than expected. The agreement should state who owns the bales, who pays for residue and how fees are adjusted.
Revenue Stream 3: Processing Fees (Stable, Medium Amount)
Some facilities negotiate long-term processing contracts with municipalities or waste companies. Instead of selling commodities directly to the market, they process material for a fixed fee per ton and deliver commodities to the contractor’s designated buyers.
For example, a municipality may pay a fixed processing fee while retaining ownership of the recovered bales. The municipality then carries more of the commodity-price risk, while the MRF receives a more predictable service payment.
Revenue under a fixed-fee contract can be estimated by multiplying the contracted fee by the tonnes processed. The actual fee and volume should come from the contract.
The advantage: This is stable, predictable income. It doesn’t fluctuate with global markets.
The disadvantage: It’s lower than commodity revenue in good markets, and the facility has less control over profitability. If operating costs spike (equipment breaks, labor gets more expensive), the facility is locked into a fee that might not cover those costs for another 2–3 years.
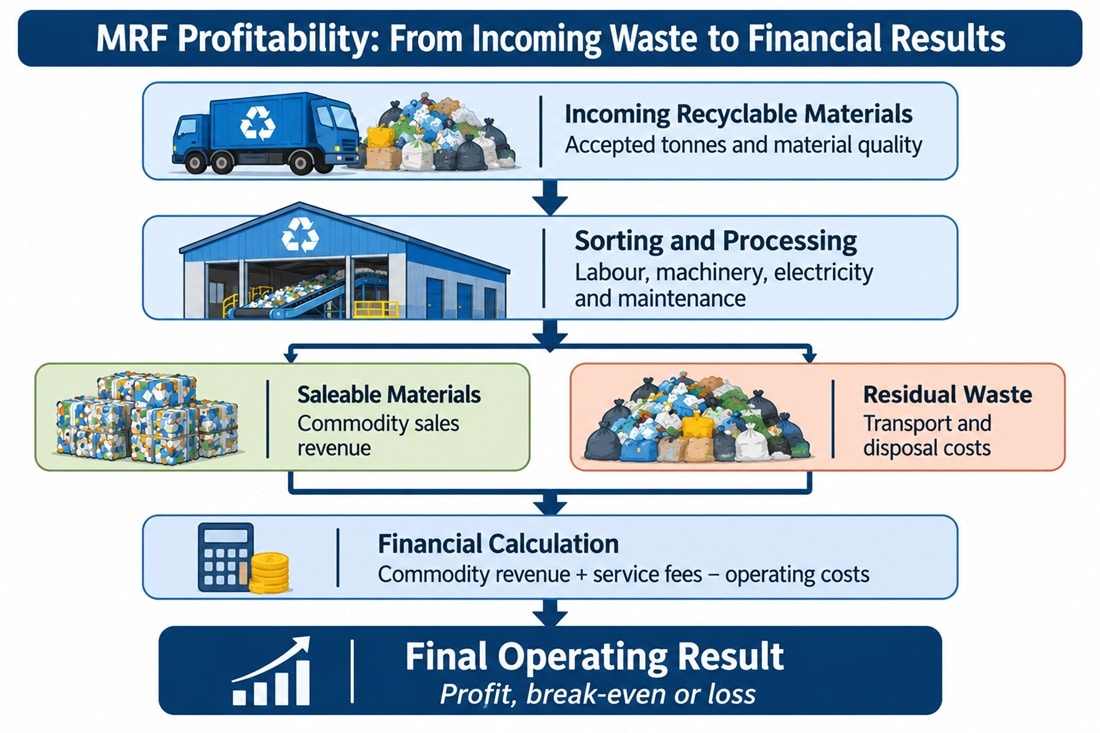
The Cost Problem: Fixed Expenses That Don’t Scale Down
Now look at the cost side. This is where the economics really break.
Operating Costs (High, Relatively Fixed)
Labor costs include wages, benefits, payroll taxes, training and staffing for sorting, equipment operation, maintenance and quality control. They vary with local wages, throughput and automation.
Equipment costs include routine maintenance, replacement parts, planned upgrades and unplanned repairs. Optical sorters, conveyors, screens, magnets and balers all require upkeep.
Electricity and fuel costs depend on operating hours, equipment configuration, throughput and local energy prices.
Residue disposal is a separate cost. A facility’s bill depends on the quantity and classification of residue, local disposal fees, transport distance and contract terms. Use a dated local quote rather than assuming a standard per-ton charge.
Compliance costs include permits, monitoring, worker safety, fire prevention and required environmental controls. Requirements vary by jurisdiction and facility.
There is no single operating-cost benchmark that applies to all MRFs. A useful estimate separates labor, maintenance, utilities, residue disposal, insurance, compliance, transport and administration.
The Fixed Cost Trap
Here’s the killer: most of these costs are fixed, not variable.
If commodity prices fall sharply, a facility cannot reduce every cost at the same rate. Staffing, equipment maintenance, rent, debt service and residue disposal do not all move in line with revenue.
When commodity prices fall, margins can compress quickly, especially at facilities that depend heavily on selling recovered commodities rather than receiving fixed processing fees.
The Capital Cost Burden
Facilities also carry capital costs from equipment purchases. MRF capital costs vary with site conditions, capacity, building requirements, collection system, equipment mix and whether the project is a new build or retrofit. A capital estimate needs a named project, year and scope.
Debt service = actual annual principal and interest payments.
A facility’s break-even point depends on its full cost structure, debt obligations, contracts and commodity revenue. It should be calculated from the operator’s own financial data.
The Profitability Math: Why Most Facilities Struggle
A simplified scenario can show how the revenue and cost categories interact. It should not be treated as an industry average.
A facility-level model should calculate commodity revenue, tipping fees and processing fees, then subtract labor, maintenance, utilities, residue handling, compliance, insurance, administration and debt service. Use audited or quoted values for each line.
Inputs to collect before modelling:
Annual incoming tonnes and actual operating days
Measured saleable output by material grade
Assumed average selling price for the recovered material mix (illustrative only)
Assumed tipping fee (illustrative only)
Processing fees and other contracted income
Revenue calculation:
Commodity revenue = saleable tonnes × realized average selling price.
Assumed tipping fee (illustrative only)
Total revenue = commodity sales + tipping fees + processing fees and any other contracted income.
Cost calculation:
Labor costs include wages, benefits, payroll taxes, training and staffing for sorting, equipment operation, maintenance and quality control. They vary with local wages, throughput and automation.
Maintenance = scheduled servicing, repairs, replacement parts and equipment upgrades.
Electricity and fuel costs depend on operating hours, equipment configuration, throughput and local energy prices.
Residue disposal cost: calculate using the facility’s measured residue tonnage and its contracted transport and disposal rates.
Environmental compliance and other overhead: use the facility’s actual annual budget.
Debt service = actual annual principal and interest payments.
Total costs = labor + maintenance + utilities + residue handling + compliance + debt service + other overhead.
Net operating result = total revenue minus total costs. Use audited facility figures before drawing conclusions.
The example shows how a facility can face a loss when its total costs exceed commodity and service revenue. Change the assumptions and the result changes; it is not a forecast for a real operator.
Debt exposure differs widely between public, private, municipal and contracted facilities. The effect of a market downturn depends on who owns the recovered materials, whether the operator receives a fixed processing fee and how much debt the facility carries.
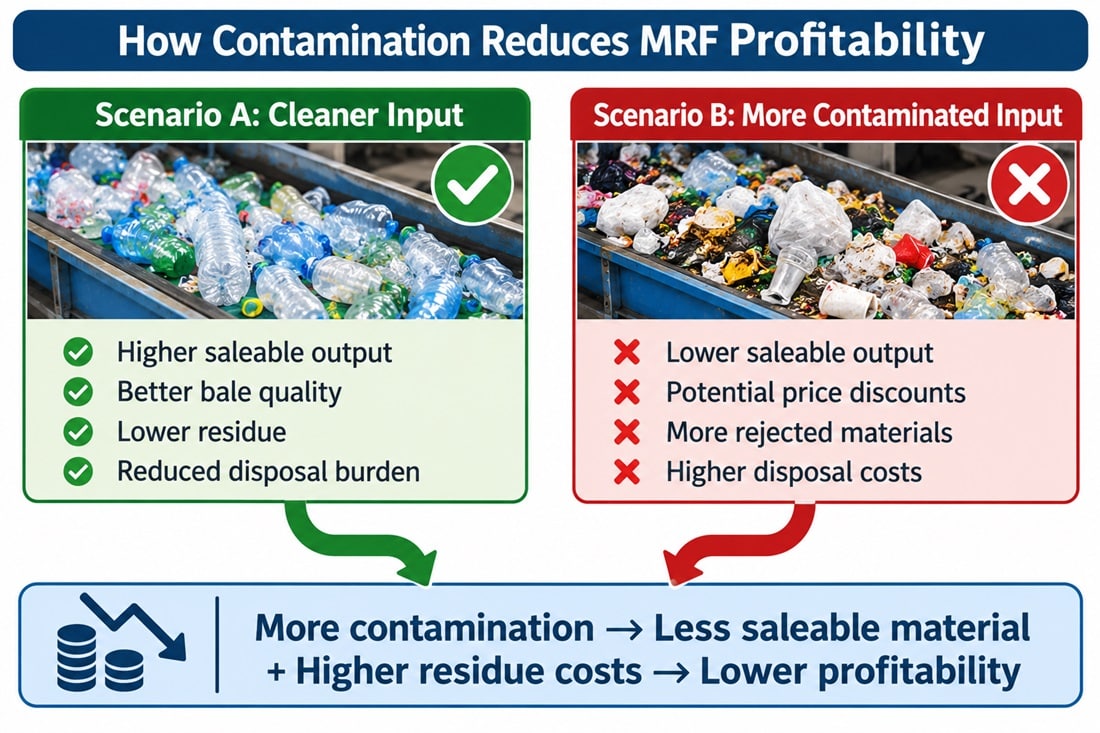
The Contamination-Economics Doom Loop
Contamination makes the economics worse, not better — and here’s why.
Scenario A: Cleaner input (illustrative comparison)
Assumed realized commodity price (illustrative only):
Commodity revenue = saleable tonnes × realized price.
Residue disposal cost: depends on local transport and disposal charges.
Scenario B: More contaminated input (illustrative comparison)
Assumed realized commodity price (illustrative only):
Commodity revenue = saleable tonnes × realized price.
Residue disposal cost: rises with residue tonnage and the local disposal rate.
The comparison illustrates the direction of the effect: lower saleable output and lower bale quality can reduce revenue, while additional residue increases disposal costs.
Calculate each scenario using actual bale grades, saleable tonnage and local disposal costs; do not reuse these figures as typical market results.
Compare the scenarios using measured saleable tonnage, actual bale prices and local disposal costs; the result will vary by facility.
The size of the financial effect depends on the facility’s material mix, contract structure and local disposal rates.
So facilities in regions with high contamination rates operate under structural disadvantage. Their only option is to either:
Accept lower margins and operate as a break-even utility (subsidized by municipalities)
Close and let material go to landfills or waste-to-energy
Profitability Models That Actually Work
A few facility models have proven economically viable. Understanding them shows what would need to change at scale.
Model 1: High-Fee Processing Contracts
Some operators use long-term processing contracts in which municipalities or haulers pay a service fee and retain ownership of the recovered commodities. This can reduce the operator’s exposure to price swings.
Advantage: Stable, predictable income. The facility can forecast cash flow and plan equipment maintenance.
Disadvantage: Caps upside (facility doesn’t benefit when commodity prices spike) and requires municipalities to be sophisticated enough to manage commodity sales or contracts themselves.
Use a named municipal contract only when the fee, quality standard and contract terms are available in a public record.
Model 2: Diversified Commodity Markets
Access to multiple buyers can give an operator more options when one market weakens, provided the material meets each buyer’s specifications.
Advantage: Reduces commodity price risk through diversification.
Disadvantage: Requires significant capital investment in multiple equipment types and operational complexity. Only large operators can manage this.
Large operators may have more options to route material between facilities and buyers, but the specific commercial arrangements are not always public.
Model 3: Integrated Facility Chains
Some operators run MRFs, plastic reprocessing plants, and direct consumer packaging in an integrated supply chain. The MRF becomes a cost center (captive supply) for the reprocessing operation rather than a profit center.
Advantage: Eliminates commodity market volatility because the next stage is internal. The reprocessor transforms sorted plastic into pellets, which feeds back into manufacturing. Stable internal pricing.
Disadvantage: Requires massive capital investment and only works for large operators with end-market connections.
Use a named example only when the facility’s ownership structure and material flows are documented.
Model 4: Automation to Reduce Labor Costs
Automation can reduce some repetitive manual tasks, but it also creates demand for technicians, software support and maintenance. Total labor savings depend on the facility’s design and operating model.
Advantage: Better economics as commodity prices fall; more competitive.
Disadvantage: automation requires capital, technical support and ongoing maintenance; it is most defensible when a facility has stable volume, suitable contracts and measurable operational gains.
The catch: Automation helps, but it doesn’t solve the fundamental problem of low and volatile commodity prices.
The Policy Levers That Could Change the Economics
Several policy tools can affect MRF economics, although there is no single agreed solution. Their results depend on program design, funding, enforcement and local market conditions.
Lever 1: Extended Producer Responsibility (EPR) with Real Financial Accountability
EPR makes producers (brands and packaging manufacturers) financially responsible for end-of-life management costs. Instead of MRFs and municipalities absorbing all costs, producers pay.
How it improves economics:
- Guaranteed revenue stream (producers fund the system directly)
- Incentivizes better packaging design (producers pay less if packaging is designed to be recyclable)
- Funds contamination prevention at source (producers can fund education, deposit systems)
Why it’s slow: Producers lobby against EPR because it shifts costs onto them. Even in states with EPR, the funding isn’t always sufficient to materially change facility economics.
Lever 2: Mandatory Commodity Price Floors or Subsidies
Price-support mechanisms and subsidies exist in some markets, but their design and scale vary. They are policy choices, not a universal feature of recycling systems.
A price-support scheme can set a minimum payment for eligible recovered material, with public funds covering some of the difference when market prices fall. The costs and incentives need careful design.
Disadvantage: Expensive for governments, doesn’t address root cause of low prices (too much contaminated material, not enough end-market demand), and can create perverse incentives (subsidize lower-quality recovery).
Status: price-support arrangements vary by jurisdiction and should be checked against current public policy documents.
Lever 3: Landfill or Incineration Cost Pressures
If landfilling or incinerating waste becomes significantly more expensive (through carbon pricing, landfill taxes, or stricter regulations), it shifts economics. Material that’s currently sent to landfill becomes worth processing at an MRF, even at lower commodity prices.
Landfill taxes, disposal fees and carbon policies can change the relative cost of treatment routes. Their effects depend on local rules and available infrastructure.
Status: landfill taxes and carbon-pricing policies differ by jurisdiction and should be described with current local sources.
Lever 4: Mandatory Material Design Standards
If regulations require that packaging be designed for recyclability at a high standard (no mixed materials, minimal adhesives, specific plastic types only), it reduces contamination, improves sorting efficiency, and increases commodity value per ton.
Advantage: Addresses the root cause (bad packaging design) rather than symptoms.
Disadvantage: Opposed by packaging manufacturers. Requires significant regulatory lift.
Status: packaging design requirements are being phased in under the EU Packaging and Packaging Waste Regulation; requirements outside the EU differ.
Structural pressures on MRF economics
MRFs operate under different ownership and funding models, including private operators, municipal facilities and public-private contracts. Financial performance should be assessed by facility and contract rather than generalized across the sector.
What Happens When Facilities Close?
When an MRF closes, a community may lose local sorting capacity. Depending on available infrastructure and contracts, collected material may be rerouted to another facility, temporarily stored, sent to disposal or excluded from collection.
Rerouted to remaining MRFs — capacity overload, quality decline
Sent to landfills — undermines recycling program
waste-to-energySent to a permitted waste-to-energy facility, where energy may be recovered but the material is not recycled
Program suspended — city stops collecting recyclables, messaging to residents that “recycling doesn’t work”
A closure can disrupt collection contracts and create uncertainty for residents. Clear public reporting about where collected material goes helps maintain trust during a transition.
The Economics Reset Recycling Faces
MRF economics depend on the balance between commodity revenue, contracted service payments, operating costs, capital investment and residue disposal. A weakness in one area can put pressure on the whole operation.
Three scenarios:
- Status quo — facilities continue to manage price volatility and cost pressures. Outcomes will differ by region, contract structure and public funding.
- Policy change — EPR funding, disposal fees and packaging-design rules may change who pays for collection and recovery. Their effect depends on implementation, funding and enforcement.
- System redesign — collection systems, deposit-return programs and packaging standards can be adjusted to improve input quality and reduce sorting complexity. Each option has costs and needs to fit local conditions.
There is no single financial model that works everywhere. Stable contracts, predictable material quality, viable end markets and transparent responsibility for residue costs can all improve the investment case.
What This Means for Your Recycling Program
If a community’s MRF faces financial difficulty, the cause may include commodity prices, contract terms, input quality, operating costs, financing or local market access. A facility-level review is needed before assigning responsibility.
Understanding this explains why:
Recycling programs are vulnerable — they’re dependent on commodity markets and government funding
Contamination has real financial consequences — it directly undermines facility profitability
Single-stream recycling is expensive to operate — clean input systems are more economical but less convenient
Ownership and scale influence access to capital and buyers, but smaller and municipal facilities can operate under different contract and funding arrangements.
Reliable recycling infrastructure needs a workable combination of collection quality, clear contracts, end-market demand, appropriate technology and sustainable funding. Sorting technology alone cannot guarantee financial viability.
Next Steps
MRF AutomationThe next article examines what automation can improve, where AI-assisted sorting is being used and why technology cannot replace stable contracts or end markets.
Recent developments and what they mean for MRFs
A useful benchmark for the scale of the investment challenge comes from the U.S. EPA’s 2024 financial assessment. It estimated that $36.5–$43.4 billion would be needed to modernize U.S. recycling infrastructure across collection and processing systems. This is not an estimate of MRF construction costs alone; it covers a wider infrastructure network and should be described that way.
Regulation is also changing the economics of packaging recovery. The EU Packaging and Packaging Waste Regulation started applying in August 2026 and establishes requirements covering packaging design, waste prevention and recycled content, with more detailed design-for-recycling criteria due later. These rules may influence demand for recovered materials and the specifications that sorting facilities must meet, although their direct effects will differ outside the EU.
Sources and further reading
- EPA U.S. recycling infrastructure assessment
- European Commission PPWR overview and implementation timeline
- European Commission Joint Research Centre assessment of chemical-recycling economics
Related guides on PlasticSolutionsReview
How material recovery facilities work | MRF contamination | MRF residue | MRF automation
Editorial note: Recovery rates, contamination levels, commodity prices and facility costs vary by location, date, material grade and contract. Where no comparable public dataset exists, this article avoids presenting a universal figure.
Leave a Reply